Last week at SCU Europe 2016 in Berlin, I presented a session on Application Publishing with Azure AD. In one of my demos I showed how to use Azure AD Application Proxy to publish an internal web application like the itnetX ITSM Portal. The session was recorded and will be available later at itnetX’s Vimeo channel and on Channel 9.
In this blog post I will detail the steps for publishing the portal in Azure AD, and also how to configure Conditional Access for Users and Devices. Device compliance and/or Domain join conditional access recently went into preview for Azure AD Applications, so this will be a good opportunity to show how this can be configured and how the user experience is.
Overview
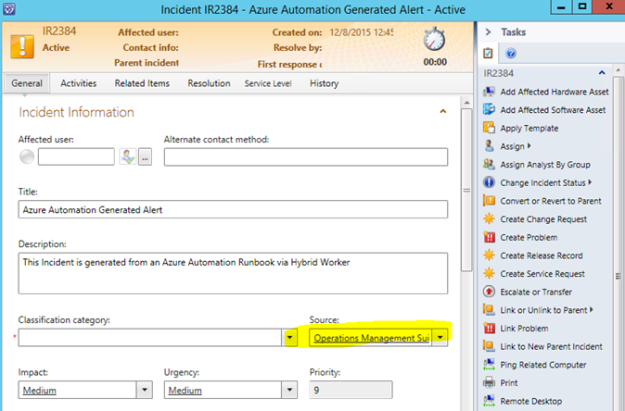
itnetX has recently released a new HTML based ITSM Portal for Service Manager, and later there will be an analyst portal as well.
This should be another good scenario for using the Azure AD Application Proxy, as the ITSM Portal Web Site needs to be installed either on the SCSM Management Server or on a Server that can connect to the Management Server internally.
In this blog article I will describe how to publish the new ITSM Portal Web Site. This will give me some interesting possibilities for either pass-through or pre-authentication and controlling user and device access.
There are two authentication scenarios for publishing the ITMS Portal Web Site with Azure AD App Proxy:
- Publish without pre-authentication (pass through). This scenario is best used when ITSM Portal is running Forms Authentication, so that the user can choose which identity they want to log in with.
- Publish with pre-authentication. This scenario will use Azure AD authentication, and is best used when ITSM Portal Web Site is running Windows Authentication so that we can have single sign-on with the Azure AD identity. Windows Authentication is also default mode for ITSM Portal installations.
I will go through both authentication scenarios here.
I went through these steps:
Configure the itnetX ITSM Portal Web Site
First I make sure that the portal is available and working internally. I have installed it on my SCSM Management Server, in my case with the URL http://azscsmms2:82.
In addition to that, I have configured the ITSM Portal to use Forms Authentication, so when I access the URL I see this:

Create the Application in Azure AD
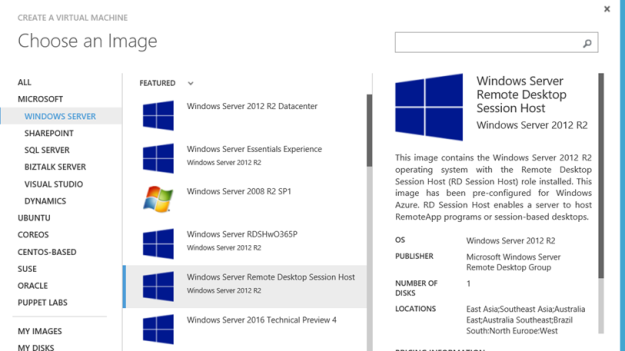
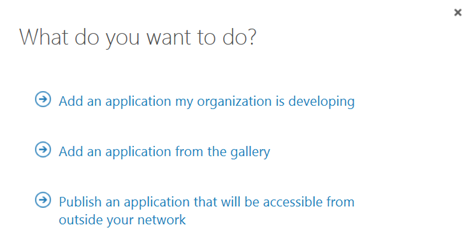
In this next step, I will create the Proxy Application in Azure AD where the ITSM Portal will be published. To be able to create Proxy Applications I will need to have either an Enterprise Mobility Suite license plan, or an Azure AD Basic/Premium license plan. App Proxy require at least Azure AD Basic for end-users accessing applications, and if using Conditional Access you will need a Azure AD Premium license. From the Azure Management Portal and Active Directory, under Applications, I add a new Application and select to “Publish an application that will be accessible from outside your network”:
I will then give a name for my application, specify the internal URL and pre-authentication method. I name my application “itnetX ITSM Portal”, use http://azscsmms2:82/ as internal URL and choose Passthrough as Pre-Authentication method.
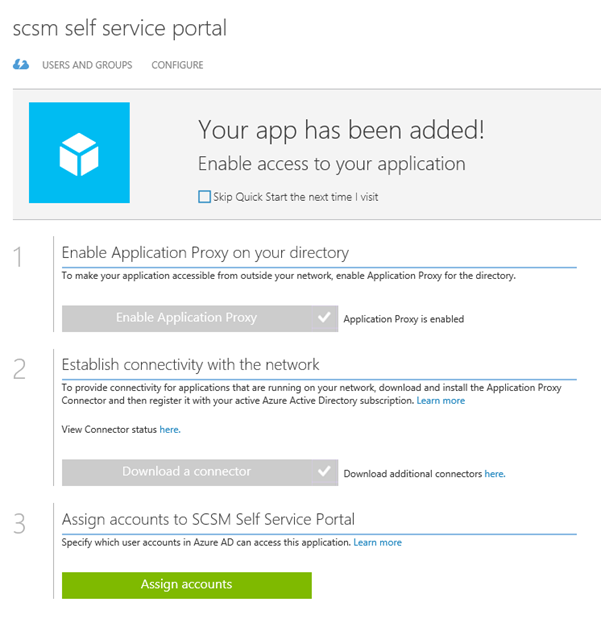
After the Proxy Application is added, there are some additional configurations to be done. If I have not already, Application Proxy for the directory have to be enabled. I have created other Proxy Applications before this, so I have already done that.
After I have uploaded my own custom logo for the application, I see this status on my quickstart blade for the application:

I also need to download the Application Proxy connector, install and register this on a Server that is member of my own Active Directory. The Server that I choose can be either on an On-Premise network, or in an Azure Network. As long as the Server running the Proxy connector can reach the internal URL, I can choose which Server that best fits my needs.
When choosing pass through as authentication method, all users can directly access the Forms Based logon page as long as they know the external URL. Assigning accounts, either users or groups, will only decide which users that will see the application in the Access Panel or My Apps.

I now need to make additional configurations to the application, and go to the Configure menu. From here I can configure the name, external URL, pre-authentication method and internal URL, if I need to change something.
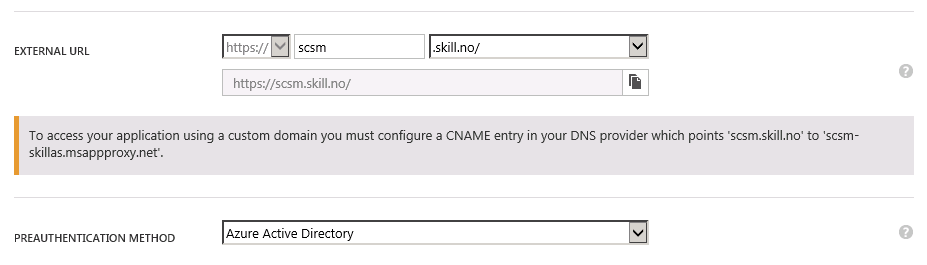
I choose to change the External URL so that I use my custom domain, and note the warning about creating a CNAME record in external DNS. After that I hit Save so that I can configure the Certificate.

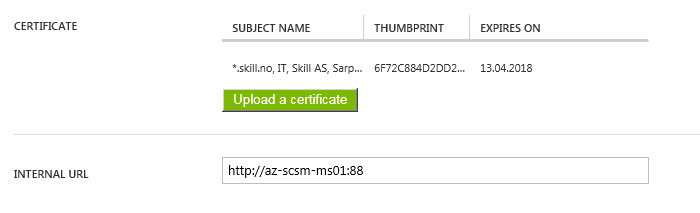
After that I upload my certificate for that URL, and I can verify the configuration for the external and internal URL:
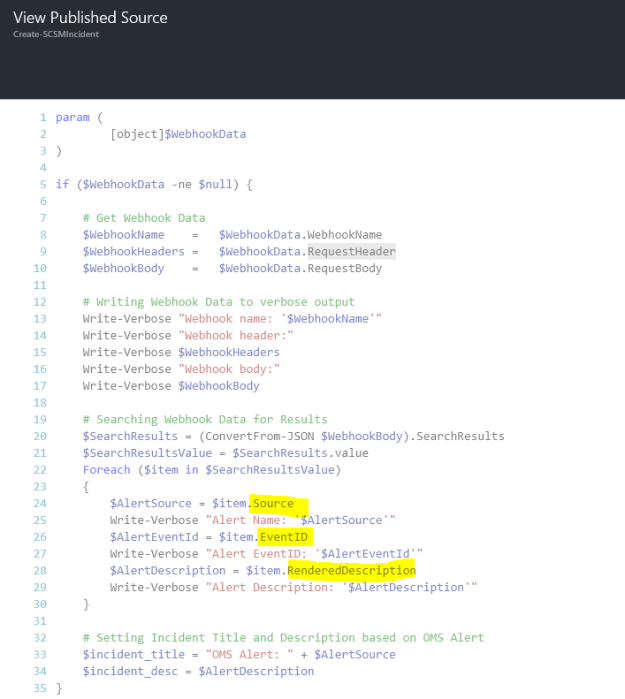
When using passthrough I don’t need to configure any internal authentication method.
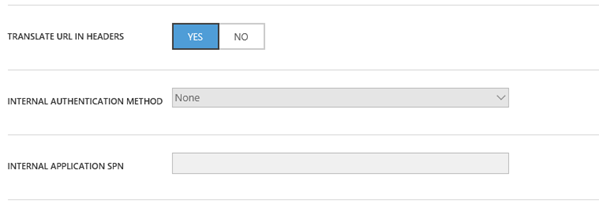
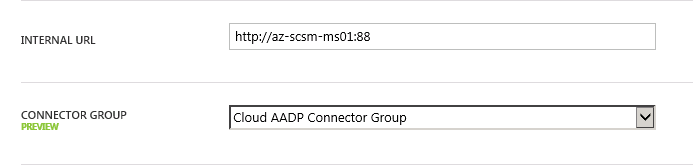
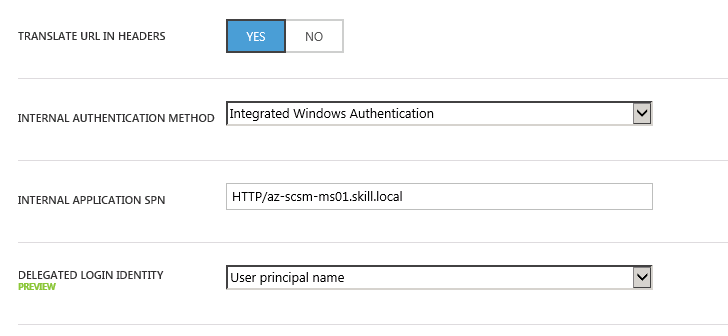
I have to select a connector group, where my installed Azure AD App Proxy Connectors are installed, and choose to have the default setting for URL translation. Internal authentication is not needed when using Pass Through authentication:

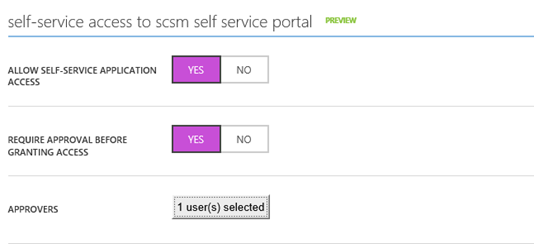
If I want, I can allow Self-Service Access to the published application. I have configured this here, so that users can request access to the application from the Access Panel (https://myapps.microsoft.com). This will automatically create an Azure AD Group for me, which I either can let users join automatically or via selected approvers:

After I have configured this, I am finished at this step, and can test the application using pass through.
Testing the application using pass through
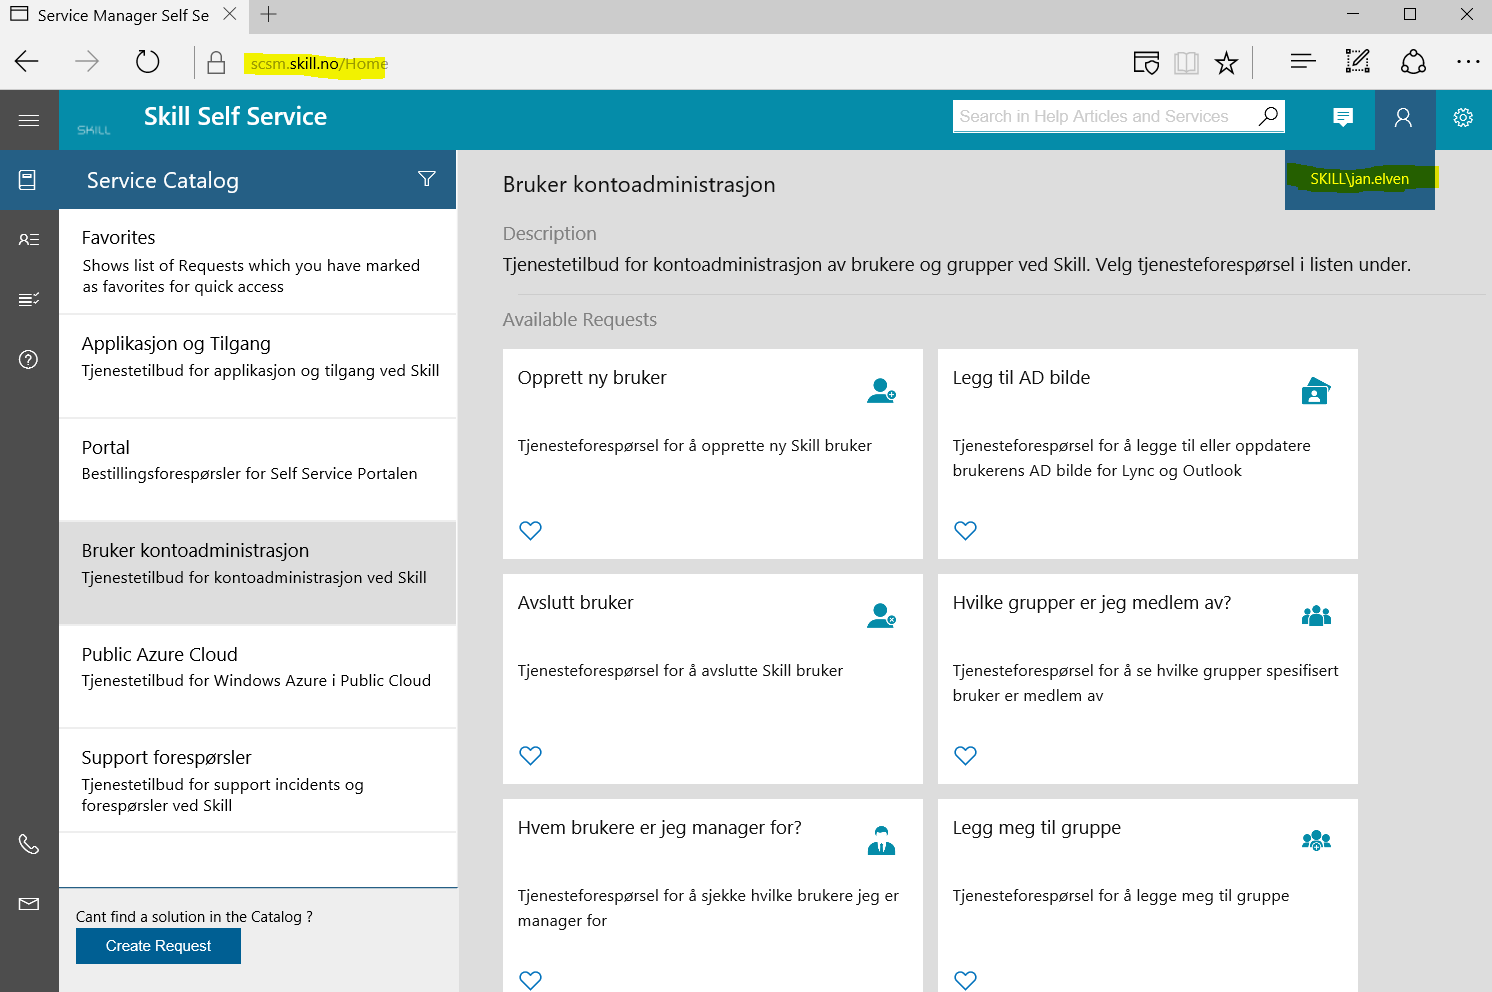
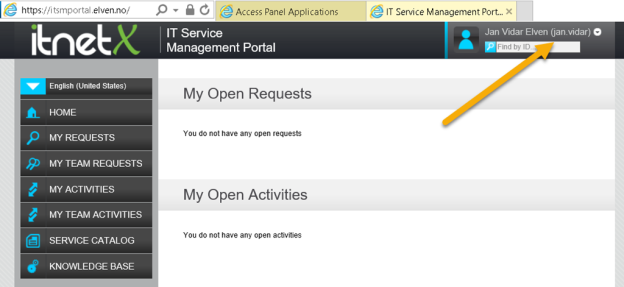
When using Pass through I can go directly to the external URL, which in my case is https://itsmportal.elven.no. And as expected, I can reach the internal Forms Based login page:

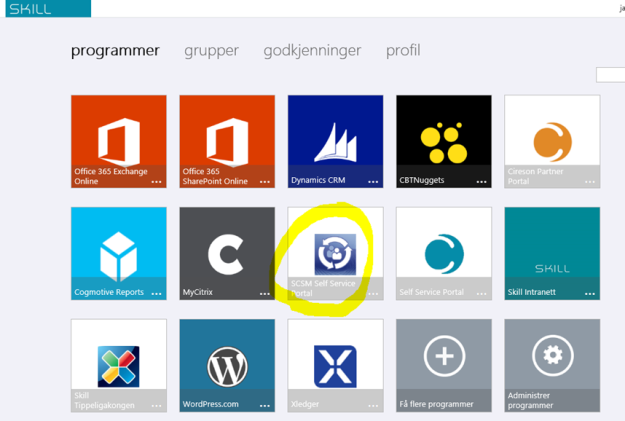
For the users and groups I have assigned access to, they will also see the itnetX ITSM Portal application in the Access Panel (https://myapps.microsoft.com) or in My Apps, this application is linked to the external URL:

This is how the Access Panel looks in the coming new look:

Now I’m ready to do the next step which is change Pre-Authentication and use Azure AD Authentication and Single Sign-On.
Change Application to use Azure AD Authentication as Preauthentication
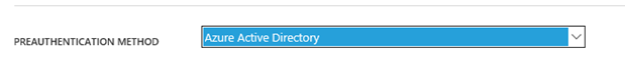
First I will reconfigure the Azure AD App Proxy Application, by changing the Preauthentication method to Azure Active Directory.
Next I need to configure to use Internal Authentication Method “Windows Integrated Authentication”. I also need to configure the Service Principal Name (SPN). Here I specify HTTP/portalserverfqdn, in my example this is HTTP/azscsmms2.elven.local.

PS! A new preview feature is available, to choose which login identity to delegate. I will continue using the default value of User principal name.
Since I now will use pre-authentication, it will be important to remember to assign individual users or groups to the Application. This enables me to control which users who will see the application under their My Apps and who will be able access the application’s external URL directly. If users are not given access they will not be able to be authorized for the application.
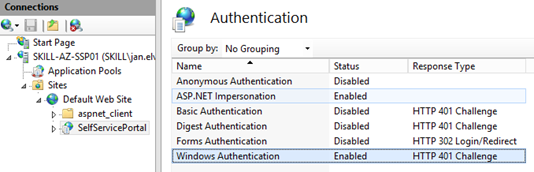
Enable Windows Authentication for itnetX ITSM Portal
The itnetX ITSM Portal site is configured for Windows Authentication by the default, but since I reconfigured the site to use Forms Authentication earlier, I just need to reverse that now. See installation and configuration documentation for that.
It is a good idea at this point to verify that Windows Integrated Authentication is working correctly by browsing internally to the ITSM Portal site. Your current logged on user (if permissions are correct) should be logged in automatically.
Configure Kerberos Constrained Delegation for the Proxy Connector Server
I now need to configure so that the Server running the Proxy Connector can impersonate users pre-authenticating with Azure AD and use Windows Integrated Authentication to the Squared Up Server.
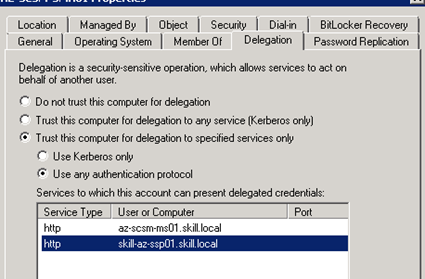
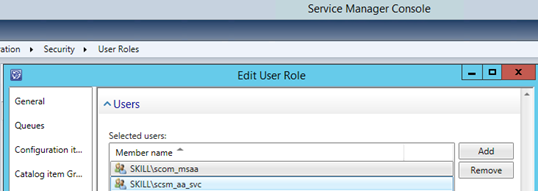
I find the Computer Account in Active Directory for the Connector Server, and on the Delegation tab click on “Trust this computer for delegation to specified services only”, and to “Use any authentication protocol”. Then I add the computer name for the web server that the ITSM Portal is installed on and specify the http service as shown below (I already have an existing delegation set up):

This was the last step in my configuration, and I am almost ready to test.
If you, like me, have an environment consisting on both On-Premise and Azure Servers in a Hybrid Datacenter, please allow room for AD replication of these SPN’s and more.
Testing the published application with Azure AD Authentication!
Now I am ready to test the published proxy application with Azure AD Authentication.
When I go to my external URL https://itsmportal.elven.no, Azure AD will check if I already has an authenticated session, or else I will presented with the customized logon page for my Azure AD:

Remember from earlier that I have assigned the application either to a group of all or some users or directly to some pilot users for example.
If I log in with an assigned user, I will be directly logged in to the ITSM Portal:

However, if I try to log in with an Azure AD account that hasn’t been assigned access to the application, I will see this message:

This means that the pre-authentication works and I can control who can access the application via Azure AD.
Conditional Access for Users and Devices
When using Azure AD as preauthentication, I can also configure the application for conditional access for users and devices. Remember this is a Azure AD Premium feature.
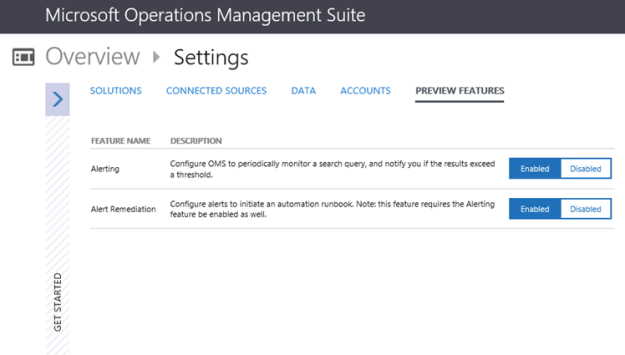
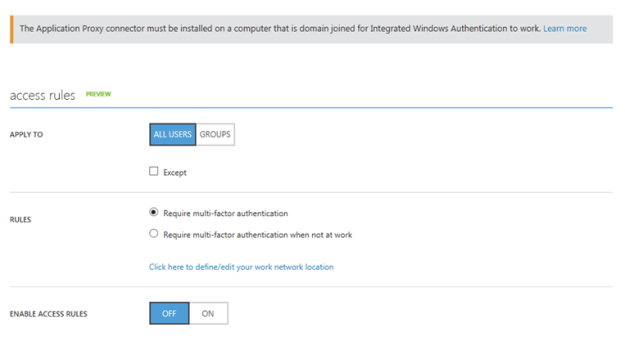
From the the configuration settings for the application I can configure Access Rules via MFA and location, and Access Rules for devices which now is in Preview:

If I enable Access Rules for MFA and location I see the following settings, where I can either for all users or for selected groups require multi-factor authentication, or require multi-factor when not at work, or block access completely from outside work. I have define my network location IP ranges for that to take effect.

If I enable Access Rules for devices, I see the following settings. I can select for all users or selected groups that will have device based access rules applied (and any exceptions to that).
I can choose between two device rules:
- All devices must me compliant
- Only selected devices must be compliant, other devices will be allowed access
If I select all devices, a sub option for windows devices shows where I need to select between domain joined or marked as compliant, or just marked as compliant or domain joined selectively.

If I select the second option, I can even specify which devices will be checked for compliancy:

So I can with different access rules for both MFA, location and selected devices, in addition to the Azure AD Preauthentication, apply the needed conditional access for my application.
In this case I will select device rules for compliant/domain joined, and for all the different devices. This will mean that for users to access the ITSM Portal, their device must either be MDM enrolled (iOS, Android, Windows Phone) or in the case of Windows devices either be MDM enrolled, Azure AD Joined, Compliant or Domain Joined. Domain joined computers must be connected to Azure AD via the steps described here: https://azure.microsoft.com/en-us/documentation/articles/active-directory-azureadjoin-devices-group-policy/.
After I’m finished reconfiguring the Azure AD App Proxy Application, I can save and continue and test with my devices.
Testing device based conditional access
Lets see first when I try to access the ITSM Portal via an unknown device:

On the details I see that my device is Unregistered, so I will not be able to access the application.
Now, in the next step I can enroll my Windows 10 Device either through MDM or via Azure AD Join. In this scenario I have added my Windows 10 to Azure AD Join:

If I look at the Access Panel and Profile I will also se my devices:

The administrator can see the Device that the user has registered in Azure Active Directory:

Lets test the published ITSM Portal again:

Now I can see that my device has been registered, but that it is not compliant yet, so I still cannot access the ITSM Portal.
When I log on to the Client Manage Portal (https://portal.manage.microsoft.com), I can see that my Windows 10 Device not yet are Compliant:

So when I investigate, fix whatever issues this device has and then re-check compliance, I can successfully verify that I should be compliant and good to go:

After that, I’m successfully able to access the ITSM Portal again, this time after my device has been checked for compliance:

Summary
In this blog post we have seen have to publish and configure the itnetX ITSM Portal with Azure AD Application Proxy, using both pass-through authentication and Azure AD Preauthentication with Kerberos constrained delegation for single sign-on.
With the additional possibility for conditional access for users and devices, we have seen that we can require either MFA or location requirements, and device compliance for mobile platforms and windows devices.
Hope this has been an informative blog post, thanks for reading!
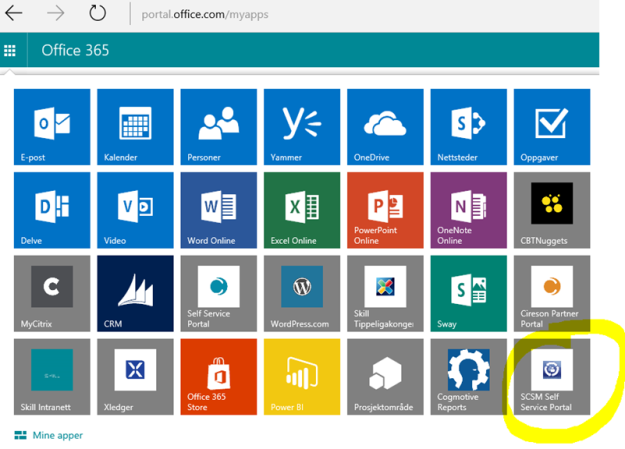
PS! In addition to access the application via the Access Panel (https://myapps.microsoft.com), I can use the App Launcher menu in Office 365 and add the ITSM Portal to the App chooser:

This will make it easy for my users to launch the application:


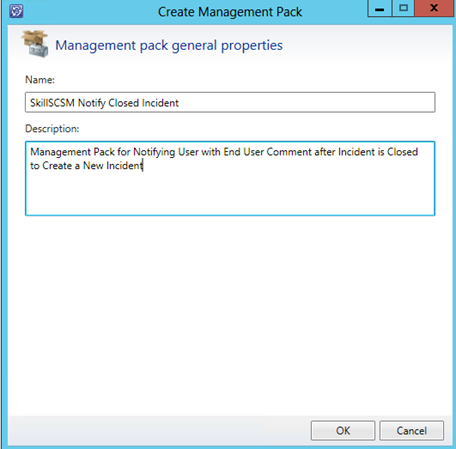


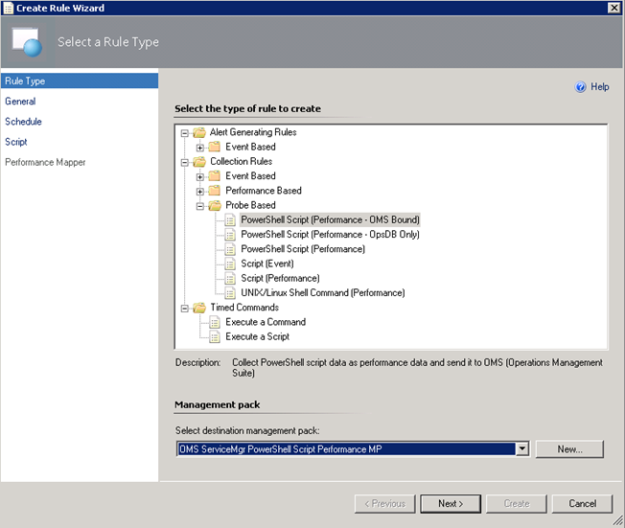
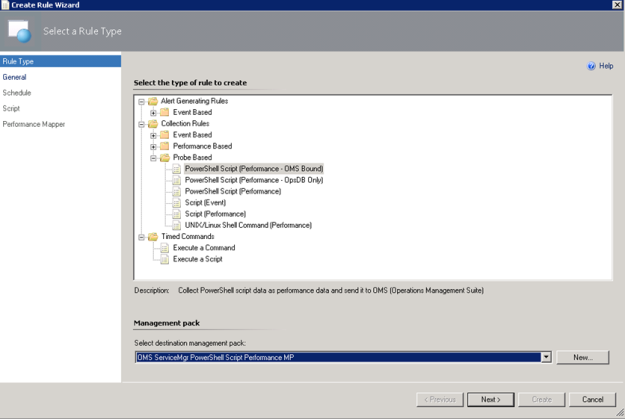 I have created a custom destination management pack for this script.
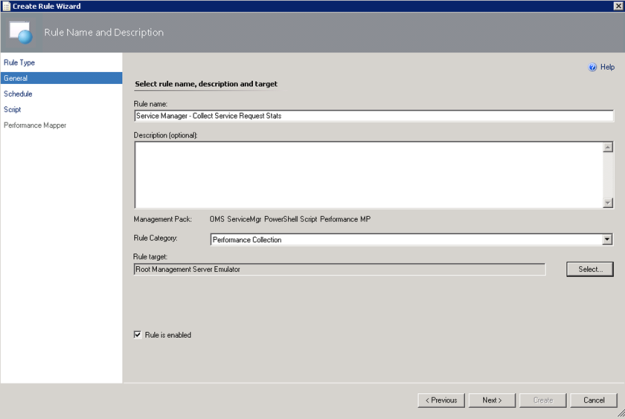
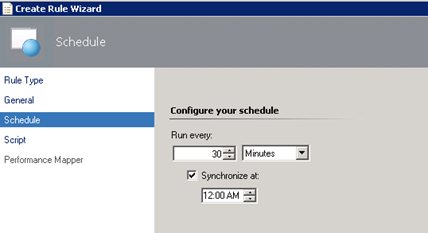

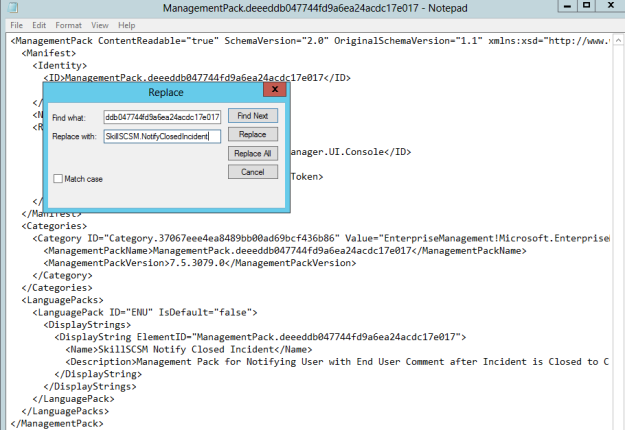
 I have created a custom destination management pack for this script.
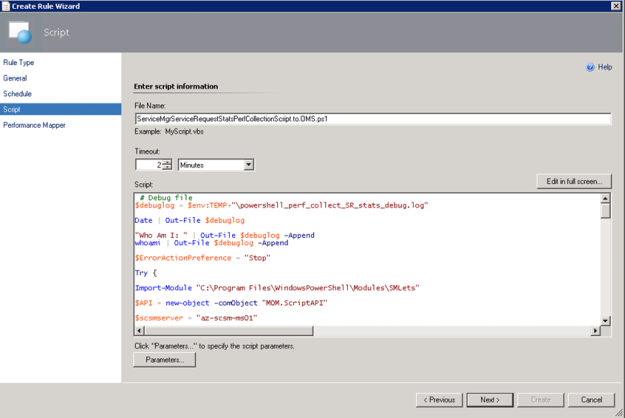