
Following up on my previous blog article on how to collect Service Manager and Incident statistics via Operations Manager to OMS, https://systemcenterpoint.wordpress.com/2016/02/19/collecting-service-manager-incident-stats-in-oms-via-powershell-script-performance-collection-in-operations-manager/, this blog article will show how to get statistics for Service Requests and display that as Performance Data in OMS.
Getting Ready
Please see the link above for the first article on getting SCSM data to OMS, and instructions for configuring your Operations Manager environment and SMLets PowerShell module. I will use that same setup as basis for this article.
Creating the PowerShell Command Script for getting SCSM Service Request data
First I needed to think about what kind of Service Request data I wanted to get from SCSM. I decided to get the following values:
- Submitted Service Requests
- In Progress Service Requests
- Completed Service Requests
- Failed Service Requests
- Cancelled Service Requests
- Closed Service Requests
- Service Requests Opened Last Day
- Service Requests Opened Last Hour
- Service Requests Completed Last Day
- New Service Requests
Now, first some thoughts on why I chose these data to get for Service Requests (SR). When New Service Requests are created, they are quickly changed to a status of either Submitted (no activities in the template the Service Request was created from) or In Progress (where there are one or more activities). SR’s with no activities are manually set to Completed by the analyst when finished, or Cancelled if the SR will not be delivered. SR’s with activities gets the status Completed when all activities are completed as well, but might also get the status of Failed if any activities fails as well, for example runbook automation activities that might fail. Finally, when SR’s are completed, they will eventually be Closed.
So it makes sense to track all these statuses as performance data. You might ask why look at New status for SR’s, when this is only an intermittent status quickly changing to either Submitted or In Progress? Well, if there is a problem with the Workflow service at the Service Manager Management Server, SR’s can be stuck in New status. This is something I would want to be able to see in OMS, and even create an Alert for.
In addition to tracking the individual status values, I also want to see data on how many SR’s are created the last day, last hour, and also how many SR’s are Completed the last day. These will be nice performance indicators.
These Service Request values will be retrieved by the Get-SCSMObject cmdlet in SMLets, using different criteria. Unlike Get-SCSMIncident which query directly for Incident Records, I have to create the PowerShell command a little bit different, by specifying the Class Object (via Get-SCSMClass) and also filter Status Enumeration Id for Service Requests via Get-SCSMEnumeration. For example to get all SR’s with a status of In Progress, I use the following command:

The complete script is shown below for how to get those SR data via SCOM to OMS:
# Debug file
$debuglog = $env:TEMP+“\powershell_perf_collect_SR_stats_debug.log“
Date | Out-File $debuglog
“Who Am I: “ | Out-File $debuglog -Append
whoami | Out-File $debuglog -Append
$ErrorActionPreference = “Stop“
Try {
Import-Module “C:\Program Files\WindowsPowerShell\Modules\SMLets“
$API = new-object -comObject “MOM.ScriptAPI“
$scsmserver = “az-scsm-ms01“
$beforetime = $(Get-Date).AddHours(–1)
$beforedate = $(Get-Date).AddDays(–1)
$PropertyBags=@()
$inprogressrequests = 0
$inprogressrequests = @(Get-SCSMObject -Computername $scsmserver –Class (Get-SCSMClass -ComputerName $scsmserver -Name System.WorkItem.ServiceRequest$) -Filter (“Status -eq ‘“ + (Get-SCSMEnumeration -ComputerName $scsmserver ServiceRequestStatusEnum.InProgress$).Id +“‘“)).Count
$PropertyBag = $API.CreatePropertyBag()
$PropertyBag.AddValue(“Instance“, “In Progress Service Requests“)
$PropertyBag.AddValue(“Value“, [UInt32]$inprogressrequests)
$PropertyBags += $PropertyBag
“In Progress Service Requests: “ | Out-File $debuglog -Append
$inprogressrequests | Out-File $debuglog -Append
$completedrequests = 0
$completedrequests = @(Get-SCSMObject -Computername $scsmserver –Class (Get-SCSMClass -ComputerName $scsmserver -Name System.WorkItem.ServiceRequest$) -Filter (“Status -eq ‘“ + (Get-SCSMEnumeration -ComputerName $scsmserver ServiceRequestStatusEnum.Completed$).Id +“‘“)).Count
$PropertyBag = $API.CreatePropertyBag()
$PropertyBag.AddValue(“Instance“, “Completed Service Requests“)
$PropertyBag.AddValue(“Value“, [UInt32]$completedrequests)
$PropertyBags += $PropertyBag
“Completed Service Requests: “ | Out-File $debuglog -Append
$completedrequests | Out-File $debuglog -Append
$submittedrequests = 0
$submittedrequests = @(Get-SCSMObject -Computername $scsmserver –Class (Get-SCSMClass -ComputerName $scsmserver -Name System.WorkItem.ServiceRequest$) -Filter (“Status -eq ‘“ + (Get-SCSMEnumeration -ComputerName $scsmserver ServiceRequestStatusEnum.Submitted$).Id +“‘“)).Count
$PropertyBag = $API.CreatePropertyBag()
$PropertyBag.AddValue(“Instance“, “Submitted Service Requests“)
$PropertyBag.AddValue(“Value“, [UInt32]$submittedrequests)
$PropertyBags += $PropertyBag
“Submitted Service Requests: “ | Out-File $debuglog -Append
$submittedrequests | Out-File $debuglog -Append
$cancelledrequests = 0
$cancelledrequests = @(Get-SCSMObject -Computername $scsmserver –Class (Get-SCSMClass -ComputerName $scsmserver -Name System.WorkItem.ServiceRequest$) -Filter (“Status -eq ‘“ + (Get-SCSMEnumeration -ComputerName $scsmserver ServiceRequestStatusEnum.Canceled$).Id +“‘“)).Count
$PropertyBag = $API.CreatePropertyBag()
$PropertyBag.AddValue(“Instance“, “Cancelled Service Requests“)
$PropertyBag.AddValue(“Value“, [UInt32]$cancelledrequests)
$PropertyBags += $PropertyBag
“Cancelled Service Requests: “ | Out-File $debuglog -Append
$cancelledrequests | Out-File $debuglog -Append
$failedrequests = 0
$failedrequests = @(Get-SCSMObject -Computername $scsmserver –Class (Get-SCSMClass -ComputerName $scsmserver -Name System.WorkItem.ServiceRequest$) -Filter (“Status -eq ‘“ + (Get-SCSMEnumeration -ComputerName $scsmserver ServiceRequestStatusEnum.Failed$).Id +“‘“)).Count
$PropertyBag = $API.CreatePropertyBag()
$PropertyBag.AddValue(“Instance“, “Failed Service Requests“)
$PropertyBag.AddValue(“Value“, [UInt32]$failedrequests)
$PropertyBags += $PropertyBag
“Failed Service Requests: “ | Out-File $debuglog -Append
$failedrequests | Out-File $debuglog -Append
$closedrequests = 0
$closedrequests = @(Get-SCSMObject -Computername $scsmserver –Class (Get-SCSMClass -ComputerName $scsmserver -Name System.WorkItem.ServiceRequest$) -Filter (“Status -eq ‘“ + (Get-SCSMEnumeration -ComputerName $scsmserver ServiceRequestStatusEnum.Closed$).Id +“‘“)).Count
$PropertyBag = $API.CreatePropertyBag()
$PropertyBag.AddValue(“Instance“, “Closed Service Requests“)
$PropertyBag.AddValue(“Value“, [UInt32]$closedrequests)
$PropertyBags += $PropertyBag
“Closed Service Requests: “ | Out-File $debuglog -Append
$closedrequests | Out-File $debuglog -Append
$newrequests = 0
$newrequests = @(Get-SCSMObject -Computername $scsmserver –Class (Get-SCSMClass -ComputerName $scsmserver -Name System.WorkItem.ServiceRequest$) -Filter (“Status -eq ‘“ + (Get-SCSMEnumeration -ComputerName $scsmserver ServiceRequestStatusEnum.New$).Id +“‘“)).Count
$PropertyBag = $API.CreatePropertyBag()
$PropertyBag.AddValue(“Instance“, “New Service Requests“)
$PropertyBag.AddValue(“Value“, [UInt32]$newrequests)
$PropertyBags += $PropertyBag
“New Service Requests: “ | Out-File $debuglog -Append
$newrequests | Out-File $debuglog -Append
$requestsopenedlasthour = 0
$requestsopenedlasthour = @(Get-SCSMObject -Computername $scsmserver –Class (Get-SCSMClass -ComputerName $scsmserver -Name System.WorkItem.ServiceRequest$) -Filter (“CreatedDate -gt ‘“ + $beforetime +“‘“)).Count
$PropertyBag = $API.CreatePropertyBag()
$PropertyBag.AddValue(“Instance“, “Service Requests Opened Last Hour“)
$PropertyBag.AddValue(“Value“, [UInt32]$requestsopenedlasthour)
$PropertyBags += $PropertyBag
“Service Requests Opened Last Hour: “ | Out-File $debuglog -Append
$requestsopenedlasthour | Out-File $debuglog -Append
$requestsopenedlastday = 0
$requestsopenedlastday = @(Get-SCSMObject -Computername $scsmserver –Class (Get-SCSMClass -ComputerName $scsmserver -Name System.WorkItem.ServiceRequest$) -Filter (“CreatedDate -gt ‘“ + $beforedate +“‘“)).Count
$PropertyBag = $API.CreatePropertyBag()
$PropertyBag.AddValue(“Instance“, “Service Requests Opened Last Day“)
$PropertyBag.AddValue(“Value“, [UInt32]$requestsopenedlastday)
$PropertyBags += $PropertyBag
“Service Requests Opened Last Day: “ | Out-File $debuglog -Append
$requestsopenedlastday | Out-File $debuglog -Append
$requestscompletedlastday = 0
$requestscompletedlastday = @(Get-SCSMObject -Computername $scsmserver –Class (Get-SCSMClass -ComputerName $scsmserver -Name System.WorkItem.ServiceRequest$) -Filter (“CompletedDate -gt ‘“ + $beforedate +“‘“)).Count
$PropertyBag = $API.CreatePropertyBag()
$PropertyBag.AddValue(“Instance“, “Service Requests Completed Last Day“)
$PropertyBag.AddValue(“Value“, [UInt32]$requestscompletedlastday)
$PropertyBags += $PropertyBag
“Service Requests Completed Last Day: “ | Out-File $debuglog -Append
$requestscompletedlastday | Out-File $debuglog -Append
$PropertyBags
} Catch {
“Error Catched: “ | Out-File $debuglog -Append
$($_.Exception.GetType().FullName) | Out-File $debuglog -Append
$($_.Exception.Message) | Out-File $debuglog -Append
}
PS! I have included debugging and logging in the script, be aware though that doing $ErrorActionPreference=Stop will end the script if any errors, for example with logging, so it might be an idea to remove the debug logging when confirmed that everything works.
In the next part I’m ready to create the PowerShell Script Rule.
Creating the PowerShell Script Rule
In the Operations Console, under Authoring, create a new PowerShell Script Rule as shown below:
- Select the PowerShell Script (Performance – OMS Bound) Rule:
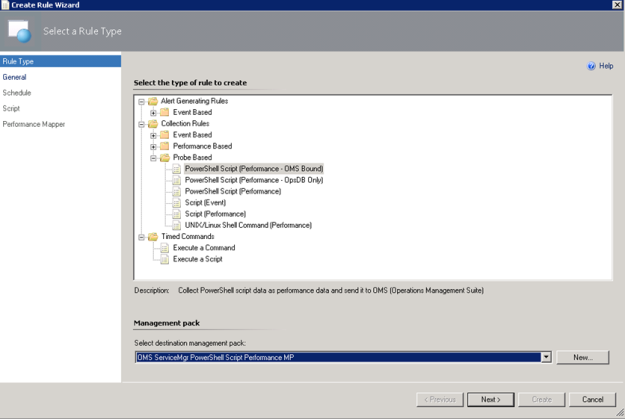 I have created a custom destination management pack for this script.
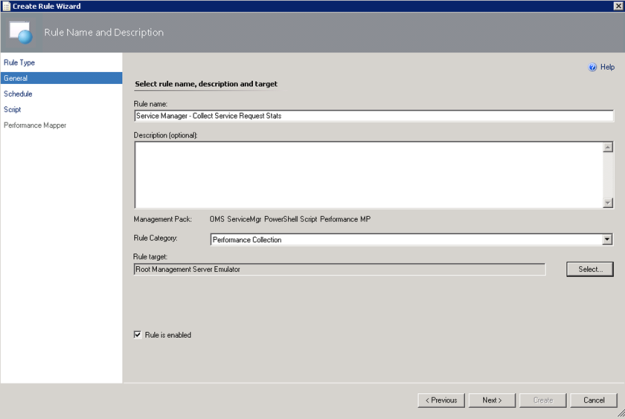
 - Specifying a Rule name and Rule Category: Performance Collection. As mentioned earlier in this article the Rule target will be the Root Management Server Emulator:
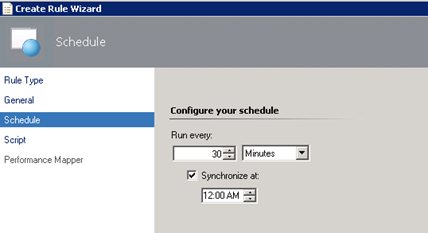
- Selecting to run the script every 30 minutes, and at which time the interval will start from:
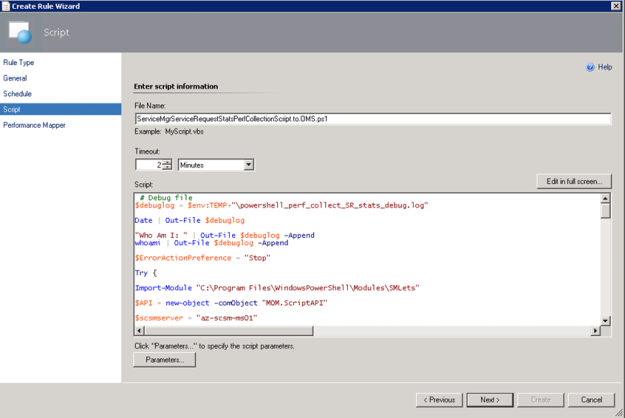
- Selecting a name for the script file and timeout, and entering the complete script as shown earlier:
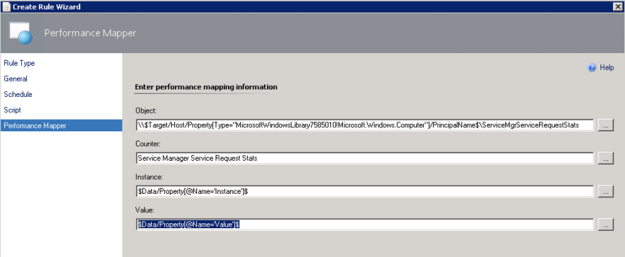
- For the Performance Mapping information, the Object name must be in the \\FQDN\YourObjectName format. For FQDN I used the Target variable for PrincipalName, and for the Object Name ServiceManagerServiceRequestStats, and adding the “\\” at the start and “\” between: \\$Target/Host/Property[Type=”MicrosoftWindowsLibrary7585010!Microsoft.Windows.Computer”]/PrincipalName$\ServiceMgrServiceRequestStatsI specified the Counter name as “Service Manager Service Request Stats”, and the Instance and Value are specified as $Data/Property(@Name=’Instance’)$ and $Data/Property(@Name=Value)$. These reflect the PropertyBag instance and value created in the PowerShell script:
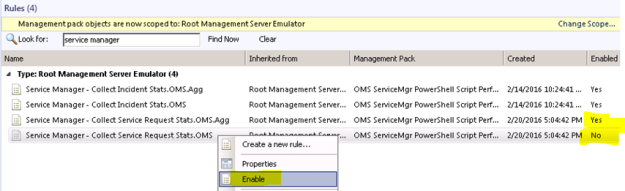
- After finishing the Create Rule Wizard, two new rules are created, which you can find by scoping to the Root Management Server Emulator I chose as target. Both Rules must be enabled, as they are not enabled by default:
At this point we are finished configuring the SCOM side, and can wait for some hours to see that data are actually coming into my OMS workspace.
Looking at Service Manager Service Request Performance Data in OMS
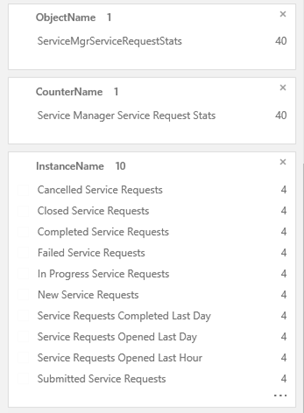
After a while I will start seeing Performance Data coming into OMS with the specified Object and Counter Name, and for the different instances and values.
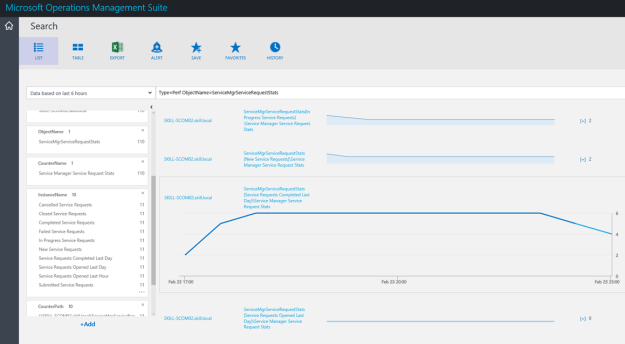
In Log Search, I can specify Type=Perf ObjectName=ServiceMgrServiceRequestStats, and I will find the Results and Metrics for the specified time frame.
I can now look at Service Manager stats as performance data, showing different scenarios like how many active, pending, resolved and closed incidents there are over a time period. I can also look at how many incidents are created by each hour or by each day.
I can also create saved searches and alerts for my search criteria.
Creating OMS Alerts for Service Request Counters
A couple of scenarios are interesting for Alerts when some of the Service Request counters pass a threshold.
Failed Service Requests is a status that will be set when an Activity in the SR fails, for example a Runbook Automation Activity. Normally you would expect that analysts would follow up on requests that fails directly in Service Manager, but it could make sense to generate an alert if the number of failed requests increases over a predefined threshold.
The search query for Failed Service Requests in OMS is:
Type=Perf ObjectName=ServiceMgrServiceRequestStats InstanceName=”Failed Service Requests”
This would give me all results for the defined time period, but to generate an alert I would want to look at the most recent results, for example for the last hour. In addition, I want to filter the results for my alert when the number of failed requests are over the threshold of 10. My query for this would be:
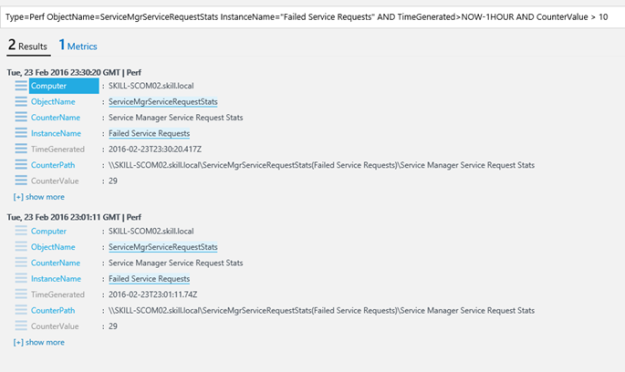
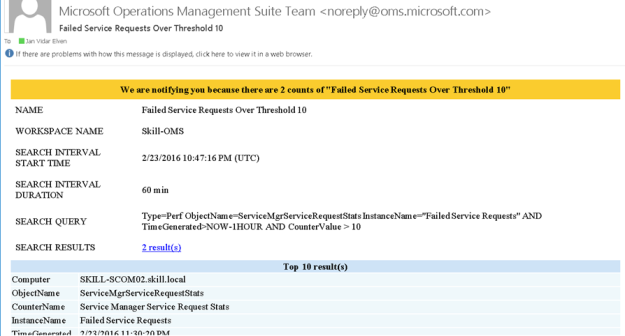
Type=Perf ObjectName=ServiceMgrServiceRequestStats InstanceName=”Failed Service Requests” AND TimeGenerated>NOW-1HOUR AND CounterValue > 10
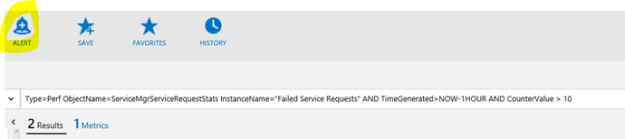
In my test environment, this gives me the following result, showing that I have a total of 29 failed requests:
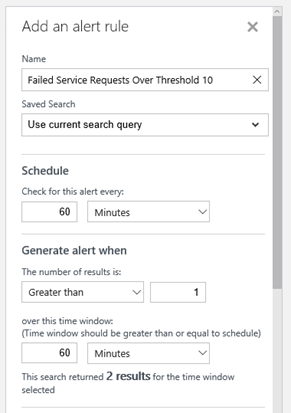
Ok, 29 failed requests are a lot, but as this is a test environment and a lot of these are old requests, I would need to do some cleaning up. I want to create an alert for this, so I press the Alert button:
For the alert I give it a name and base it on the search query. I want to check every 60 minutes, and generate alert when the number of results is greater than 1 so that I make sure the passing of the threshold is consistent and not just temporary.
For actions I want an email notification, so I type in a Subject and my recipients.
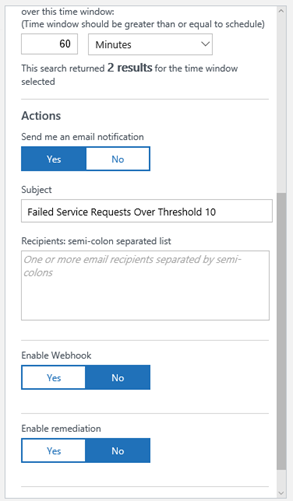
I Save the alert rule, and verify that it was successfully created.
Soon I get my first alert on email:
There is also a second scenario for an alert, and that is when Service Requests get stuck in a New status. Normally this would be when Service Manager workflows are not running, so it will be important to get notified on that.
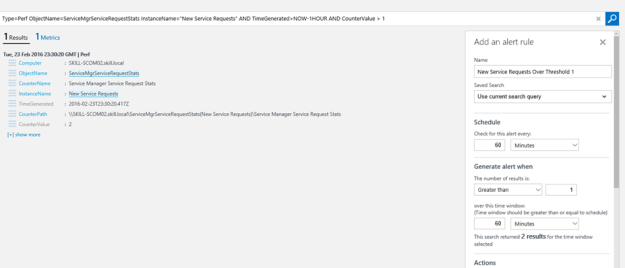
The following search query, using countervalue > 1 will provide the results for my alert as I want to get notified as soon there is more than one value in the results:
Type=Perf ObjectName=ServiceMgrServiceRequestStats InstanceName=”New Service Requests” AND TimeGenerated>NOW-1HOUR AND CounterValue > 1
And I can create my alert as the following image:
With that, this blog post is concluded. Thanks for reading, I hope the posts on OMS and getting SCSM data via NRT Perfomance Collection has been useful 😉
