Category Archives: Operations Managment Suite

Experts and Community unite at last ever #SCU_Europe 2016! #ExpertsLive next

This years SCU Europe 2016, for the first time outside Switzerland in the 4th year running, was held in Berlin at the BCC (Berlin Congress Center) close to the Alexander Platz in the eastern parts of “Berlin Mitte”.


The intro video introducing the Experts:

Let’s begin with the end: at the closing note SCUE general Marcel Zehner announced and with a little bit of emotion that this was the last ever SCU Europe to be held.. You and your organization should be proud of what you have achieved, Marcel, it is one of the best community conferences around, and I have been fortunate to be able to visit all 4 starting with Bern in 2013, Basel in 2014 and 2015, and now Berlin in 2016. It’s only cities with B’s is it? In fact, you never know what twists and turns your career takes, but looking back I’m not sure I would be where I am now in turn of being presenter, MVP and community influencer myself if I had not travelled alone to Bern 4 years ago, that’s where I really started working with and for the Community (with a capitol C)!

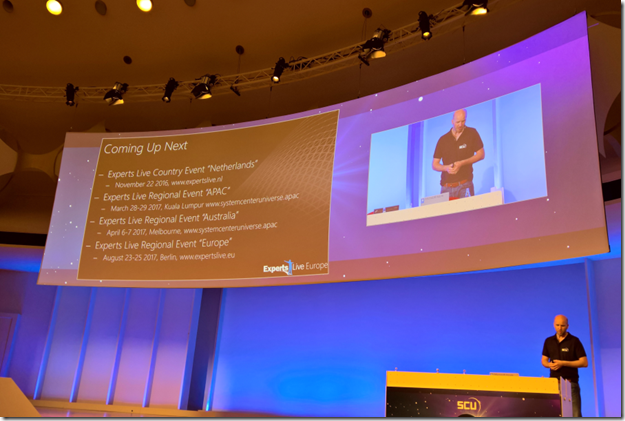
Luckily SCU Europe will continue as Experts Live Europe next year! Same place at BCC, same organization and format, and the same dates only next year it will be: 23rd – 25th of August 2017. A new web page was launched, www.expertslive.eu, and Twitter (@ExpertsLiveEU) and Facebook have been changed to reflect that. The hash tag #SCU_Europe will eventually be inactive and you should now use #ExpertsLive.

image

I think this is a very good decision, there has already been discussion on that the name “System Center Universe” is not really reflecting the content and focus of the conference, now embracing the Cloud, with content areas for Management, Productivity, Security, DevOps, Automation, Data Platform and more. ExpertsLive, originally a 1-day community conference in Netherland running each year back from 2009 and with up to 1200 participants, will now be a network of conferences, ranging from region based (ExpertsLive Europe, but also SCU APAC and SCU Australia will be ExpertsLive APAC and Australia next year), and local, country based ExpertsLive like the one in Netherlands, but more will come.

image

The closing note video announcing Experts Live Europe:

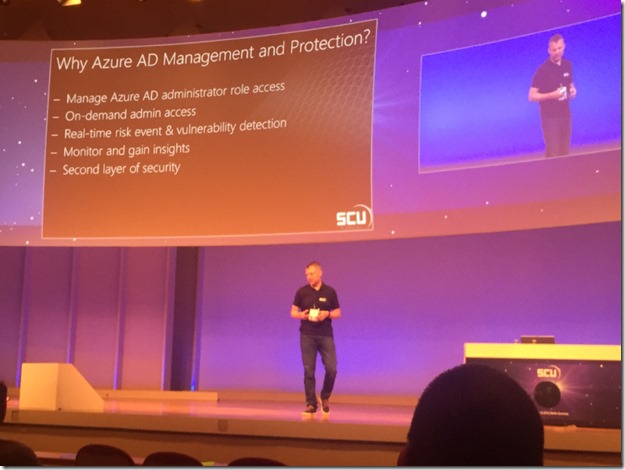
This year at SCU Europe I was one of the Experts and presented two sessions on “Premium Identity Management and Protection with Azure AD” and “Deep Dive: Publishing Applications with Azure AD”. I also took part in a “Ask-the-Experts” area together with Cameron Fuller and Kevin Greene where we took questions on the topic System Center 2016. I participated on a discussion panel on Friday morning with Markus Wilhelm from Microsoft Germany on the subject Defense Strategies and Security, and of course we had the Meet and greet with the Experts at the Networking party. It was a really great experience speaking at this conference, thanks for having me!


The content of the conference this year was great, and for the first time there was 5 tracks, with over 70 sessions presented! All presentations and session recordings will be at Channel 9 in a few weeks time, so make sure you look at anything you missed or want to see again if you where there, or if you weren’t at the conference this year you can look at your sessions of interest.

I was travelling with a group this year, both from my company and some of our customers, in total we were 7 in the group, and also had 3 cancellations the last week before the conference from some customers that could not make it after all. Moving the conference to Berlin is a big part of why it now was easier to attract more Nordic attendance I think. We stayed at the Park Inn by Radisson right by the Alexander Platz and BCC, so it was really central and nice.


In good tradition there are a lot of parties and social networking going on. On the first night there are the Sponsors and Speakers Party, which was held in Mio right by the TV Tower by Alexander Platz, on Thursday we had the attendee Networking Party at the conference center. Later that night our group and some more partners/customers of Squared Up went on to another party at Cosmic Kaspar. It was really hot, so basically the party was at the pavement! On the last day we had the Closing Drinks, sponsored by Cireson and itnetX at Club Carambar, also close to the Alexander Platz. In addition, there are a lot of unofficial gatherings going on, lots of laughs and new and old friends have a good time.


See you next year at Experts Live Europe in Berlin 23-25th August, 2017!

Displaying Azure Automation Runbook Stats in OMS via Performance Collection and Operations Manager

Wouldn’t it be great to get some more information about your Azure Automation Runbooks in the Operations Management Suite Portal? That’s a rhetorical question, of course the answer will be yes!

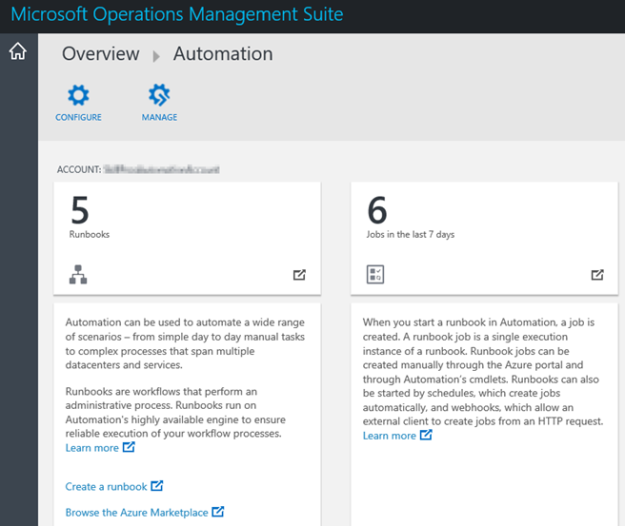
While Azure Automation is a part of the suite of components in OMS, today you only get the following information from the Azure Automation blade:
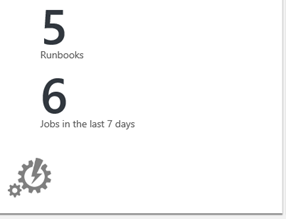
The blade shows the number of runbooks and jobs from the one Automation Account you have configured. You can only configure one Automation Account at a time, and for getting more details you are directed to the Azure Portal.
I wanted to use my OMS-connected Operations Manager Management Group, and use a PowerShell script rule to get some more statistics for Azure Automation and display that in OMS Log Analytics as Performance Data. I will do this using the “Sample Management Pack – Wizard to Create PowerShell script Collection Rules” described in this blog article http://blogs.msdn.com/b/wei_out_there_with_system_center/archive/2015/09/29/oms-collecting-nrt-performance-data-from-an-opsmgr-powershell-script-collection-rule-created-from-a-wizard.aspx.

I will use the AzureRM PowerShell Module for the PowerShell commands that will connect to my Azure subscription and get the Azure Automation Runbooks data.

Getting Ready

Before I can create the PowerShell script rule for gettting the Azure Automation data, I have to do some preparations first. This includes:

  1. Importing the “Sample Management Pack – Wizard to Create PowerShell script Collection Rules” to my Operations Manager environment.
    1. This can be downloaded from Technet Gallery at https://gallery.technet.microsoft.com/Sample-Management-Pack-e48040f7.
  2. Install the AzureRM PowerShell Module (at the chosen Target server for the PowerShell Script Rule).
    1. I chose to install it from the PowerShell Gallery using the instructions here: https://azure.microsoft.com/en-us/documentation/articles/powershell-install-configure/
    2. If you are running Windows Server 2012 R2, which I am, follow the instructions here to support the PowerShellGet module, https://www.powershellgallery.com/GettingStarted?section=Get%20Started.
  3. Choose Target for where to run the AzureRM commands from
    1. Regarding the AzureRM and where to install, I decided to use the SCOM Root Management Server Emulator. This server will then run the AzureRM commands against my Azure Subscription.
  4. Choose account for Run As Profile
    1. I also needed to think about the run as account the AzureRM commands will run under. As we will see later the PowerShell Script Rules will be set up with a Default Run As Profile.
    2. The Default Run As Profile for the RMS Emulator will be the Management Server Action Account, if I had chosen another Rule Target the Default Run As Profile would be the Local System Account.
    3. Alternatively, I could have created a custom Run As Profile with a user account that have permissions to execute the AzureRM cmdlets and connect to and read the required data from the Azure subscription, and configure the PowerShell Script rules to use that.
    4. I decided to go with the Management Server Action Account, in my case SKILL\scom_msaa. This account will execute the AzureRM PowerShell cmdlets, so I need to make sure that I can login to my Azure subscription using that account.
  5. Next, I started PowerShell ISE with “Run as different user”, specifying my scom_msaa account. I run the commands below, as I wanted to save the password for the user I’m going to connect to the Azure subscription and get the Automation data. I also did a test import-module of the AzureRM modules I will need in the main script.
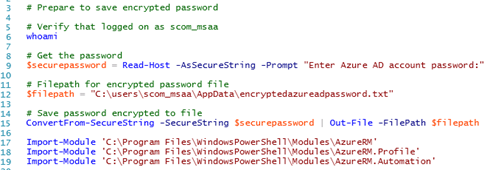
The commands above are here in full:


# Prepare to save encrypted password

# Verify that logged on as scom_msaa
whoami

# Get the password
$securepassword = Read-Host -AsSecureString -Prompt Enter Azure AD account password:

# Filepath for encrypted password file
$filepath = C:\users\scom_msaa\AppData\encryptedazureadpassword.txt

# Save password encrypted to file
ConvertFrom-SecureString -SecureString $securepassword | Out-File -FilePath $filepath

Import-Module C:\Program Files\WindowsPowerShell\Modules\AzureRM
Import-Module C:\Program Files\WindowsPowerShell\Modules\AzureRM.Profile
Import-Module C:\Program Files\WindowsPowerShell\Modules\AzureRM.Automation

At this point I’m ready for the next step, which is to create some PowerShell commands for the Script Rule in SCOM.

Creating the PowerShell Command Script for getting Azure Automation data

First I needed to think about what kind of Azure Automation and Runbook data I wanted to get from my Azure Subscription. I decided to get the following values:

  • Job Count Last Day
  • Job Count Last Month
  • Job Count This Month
  • Job Minutes This Month
  • Runbooks in New State
  • Runbooks in Published State
  • Runbooks in Edit State
  • PowerShell Workflow Runbooks
  • Graphical Runbooks
  • PowerShell Script Runbooks

I wanted to have the statistics for Runbooks Jobs to see the activity of the Runbooks. As I’m running the Free plan of Azure Automation, I’m restricted to 500 minutes a month, so it makes sense to count the accumulated job minutes for the month as well.

In addition to this I want some statistics for the number of Runbooks in the environment, separated on New, Published and Edit Runbooks, and the Runbook type separated on Workflow, Graphical and PowerShell Script.
The PowerShell Script Rule for getting these data will be using the AzureRM PowerShell Module, and specifically the cmdlets in AzureRM.Profile and AzureRM.Automation:

To log in and authenticate to Azure, I will use the encrypted password saved earlier, and create a Credential object for the login:

Initializing the script with date filters and setting default values for variables. I decided to create the script so that I can get data from all the Resource Groups I have Automation Accounts in. This way, If I have multiple Automation Accounts, I can get statistics combined for each of them:

Then, looping through each Resource Group, running the different commands to get the variable data. Since I potentially will loop through multiple Resource Groups and Automation Accounts, the variables will be using += to add to the previous loop value:

After setting each variable and exiting the loop, the $PropertyBag can be filled with the values for the different counters:

The complete script is shown below for how to get those Azure Automation data via SCOM and PowerShell Script Rule to to OMS:


# Debug file
$debuglog = $env:TEMP+\powershell_perf_collect_AA_stats_debug.log

Date | Out-File $debuglog

Who Am I: | Out-File $debuglog -Append
whoami |
Out-File $debuglog -Append

$ErrorActionPreference = Stop

Try {

If (!(Get-Module –Name AzureRM)) { Import-Module C:\Program Files\WindowsPowerShell\Modules\AzureRM }
If (!(Get-Module –Name AzureRM.Profile)) { Import-Module C:\Program Files\WindowsPowerShell\Modules\AzureRM.Profile }
If (!(Get-Module –Name AzureRM.Automation)) { Import-Module C:\Program Files\WindowsPowerShell\Modules\AzureRM.Automation }

# Get Cred for ARM
$filepath = C:\users\scom_msaa\AppData\encryptedazureadpassword.txt
$userName = myAzureADAdminAccount
$securePassword = ConvertTo-SecureString (Get-Content -Path $FilePath)
$cred = New-Object -TypeName System.Management.Automation.PSCredential ($username, $securePassword)

# Log in and sett active subscription
Login-AzureRmAccount -Credential $cred

$subscriptionid = mysubscriptionID

Set-AzureRmContext -SubscriptionId $subscriptionid

$API = new-object -comObject MOM.ScriptAPI

$aftertime = $(Get-Date).AddHours(1)
$afterdate_lastday = $(Get-Date).AddDays(1)
$afterdate_lastmonth = $(Get-Date).AddDays(30)
$afterdate_thismonth = $(Get-Date).AddDays(($(Get-Date).Day)+1)

$AutomationRGs = @(MyResourceGroupName1,MyResourceGroupName2)

$PropertyBags=@()

$newrunbooks = 0
$publishedrunbooks = 0
$editrunbooks = 0
$scriptrunbooks = 0
$graphrunbooks = 0
$powershellrunbooks = 0
$jobcountlastday = 0
$jobcountlastmonth = 0
$jobcountthismonth = 0
$jobminutesthismonth = 0

ForEach ($AutomationRG in $AutomationRGs) {

$rmautomationacct = Get-AzureRmAutomationAccount -ResourceGroupName $AutomationRG

$newrunbooks += (Get-AzureRmAutomationRunbook -AutomationAccountName $rmautomationacct.AutomationAccountName -ResourceGroupName $AutomationRG `
|
Where {$_.State -eq New}).Count

$publishedrunbooks += (Get-AzureRmAutomationRunbook -AutomationAccountName $rmautomationacct.AutomationAccountName -ResourceGroupName $AutomationRG `
|
Where {$_.State -eq Published}).Count

$editrunbooks += (Get-AzureRmAutomationRunbook -AutomationAccountName $rmautomationacct.AutomationAccountName -ResourceGroupName $AutomationRG `
|
Where {$_.State -eq Edit}).Count

$scriptrunbooks += (Get-AzureRmAutomationRunbook -AutomationAccountName $rmautomationacct.AutomationAccountName -ResourceGroupName $AutomationRG `
|
Where {$_.RunbookType -eq Script}).Count

$graphrunbooks += (Get-AzureRmAutomationRunbook -AutomationAccountName $rmautomationacct.AutomationAccountName -ResourceGroupName $AutomationRG `
|
Where {$_.RunbookType -eq Graph}).Count

$powershellrunbooks += (Get-AzureRmAutomationRunbook -AutomationAccountName $rmautomationacct.AutomationAccountName -ResourceGroupName $AutomationRG `
|
Where {$_.RunbookType -eq PowerShell}).Count

$jobcountlastday += (Get-AzureRmAutomationJob -AutomationAccountName $rmautomationacct.AutomationAccountName -ResourceGroupName $AutomationRG `
-StartTime
$afterdate_lastday).Count

$jobcountlastmonth += (Get-AzureRmAutomationJob -AutomationAccountName $rmautomationacct.AutomationAccountName -ResourceGroupName $AutomationRG `
-StartTime
$afterdate_lastmonth).Count

$jobcountthismonth += (Get-AzureRmAutomationJob -AutomationAccountName $rmautomationacct.AutomationAccountName -ResourceGroupName $AutomationRG `
-StartTime
$afterdate_thismonth.ToLongDateString()).Count

$jobsthismonth = Get-AzureRmAutomationJob -AutomationAccountName $rmautomationacct.AutomationAccountName -ResourceGroupName $AutomationRG `
-StartTime
$afterdate_thismonth.ToLongDateString() | Select-Object RunbookName, StartTime, EndTime, CreationTime, LastModifiedTime, @{Name=RunningTime;Expression={[TimeSpan]::Parse($_.EndTime $_.StartTime).TotalMinutes}}, @{Name=Month;Expression={($_.EndTime).Month}}

$jobminutesthismonth += [int][Math]::Ceiling(($jobsthismonth | Measure-Object -Property RunningTime -Sum).Sum)

}

$PropertyBag = $API.CreatePropertyBag()
$PropertyBag.AddValue(Instance, Job Count Last Day)
$PropertyBag.AddValue(Value, [UInt32]$jobcountlastday)
$PropertyBags += $PropertyBag

Job Count Last Day: | Out-File $debuglog -Append
$jobcountlastday | Out-File $debuglog -Append

$PropertyBag = $API.CreatePropertyBag()
$PropertyBag.AddValue(Instance, Job Count Last Month)
$PropertyBag.AddValue(Value, [UInt32]$jobcountlastmonth)
$PropertyBags += $PropertyBag

Job Count Last Month: | Out-File $debuglog -Append
$jobcountlastmonth | Out-File $debuglog -Append

$PropertyBag = $API.CreatePropertyBag()
$PropertyBag.AddValue(Instance, Job Count This Month)
$PropertyBag.AddValue(Value, [UInt32]$jobcountthismonth)
$PropertyBags += $PropertyBag

Job Count This Month: | Out-File $debuglog -Append
$jobcountthismonth | Out-File $debuglog -Append

$PropertyBag = $API.CreatePropertyBag()
$PropertyBag.AddValue(Instance, Job Minutes This Month)
$PropertyBag.AddValue(Value, [UInt32]$jobminutesthismonth)
$PropertyBags += $PropertyBag

Job Minutes This Month: | Out-File $debuglog -Append
$jobminutesthismonth | Out-File $debuglog -Append

$PropertyBag = $API.CreatePropertyBag()
$PropertyBag.AddValue(Instance, Runbooks in New State)
$PropertyBag.AddValue(Value, [UInt32]$newrunbooks)
$PropertyBags += $PropertyBag

Runbooks in New State: | Out-File $debuglog -Append
$newrunbooks | Out-File $debuglog -Append

$PropertyBag = $API.CreatePropertyBag()
$PropertyBag.AddValue(Instance, Runbooks in Published State)
$PropertyBag.AddValue(Value, [UInt32]$publishedrunbooks)
$PropertyBags += $PropertyBag

Runbooks in Published State: | Out-File $debuglog -Append
$publishedrunbooks | Out-File $debuglog -Append

$PropertyBag = $API.CreatePropertyBag()
$PropertyBag.AddValue(Instance, Runbooks in Edit State)
$PropertyBag.AddValue(Value, [UInt32]$editrunbooks)
$PropertyBags += $PropertyBag

Runbooks in Edit State: | Out-File $debuglog -Append
$editrunbooks | Out-File $debuglog -Append

$PropertyBag = $API.CreatePropertyBag()
$PropertyBag.AddValue(Instance, PowerShell Workflow Runbooks)
$PropertyBag.AddValue(Value, [UInt32]$scriptrunbooks)
$PropertyBags += $PropertyBag

PowerShell Workflow Runbooks: | Out-File $debuglog -Append
$scriptrunbooks | Out-File $debuglog -Append

$PropertyBag = $API.CreatePropertyBag()
$PropertyBag.AddValue(Instance, Graphical Runbooks)
$PropertyBag.AddValue(Value, [UInt32]$graphrunbooks)
$PropertyBags += $PropertyBag

Graphical Runbooks: | Out-File $debuglog -Append
$graphrunbooks | Out-File $debuglog -Append

$PropertyBag = $API.CreatePropertyBag()
$PropertyBag.AddValue(Instance, PowerShell Script Runbooks)
$PropertyBag.AddValue(Value, [UInt32]$powershellrunbooks)
$PropertyBags += $PropertyBag

PowerShell Script Runbooks: | Out-File $debuglog -Append
$powershellrunbooks | Out-File $debuglog -Append

$PropertyBags

} Catch {

Error Catched: | Out-File $debuglog -Append
$(
$_.Exception.GetType().FullName) | Out-File $debuglog -Append
$(
$_.Exception.Message) | Out-File $debuglog -Append

}

PS! I have included debugging and logging in the script, be aware though that doing $ErrorActionPreference=Stop will end the script if any errors, for example with logging, so it might be an idea to remove the debug logging when confirmed that everything works.

In the next part I’m ready to create the PowerShell Script Rule.

Creating the PowerShell Script Rule

In the Operations Console, under Authoring, create a new PowerShell Script Rule as shown below:

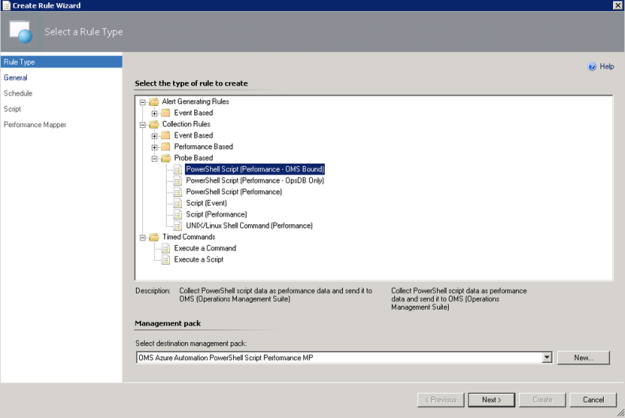
  1. Select the PowerShell Script (Performance – OMS Bound) Rule:I have created a custom destination management pack for this script.
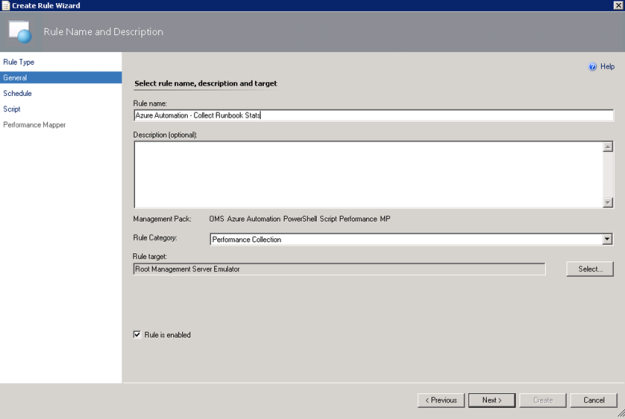
  2. Specifying a Rule name and Rule Category: Performance Collection. As mentioned earlier in this article the Rule target will be the Root Management Server Emulator:
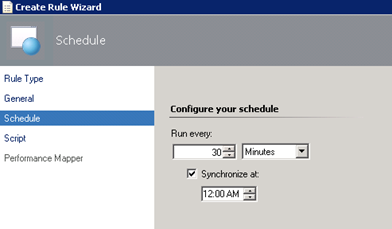
  3. Selecting to run the script every 30 minutes, and at which time the interval will start from:
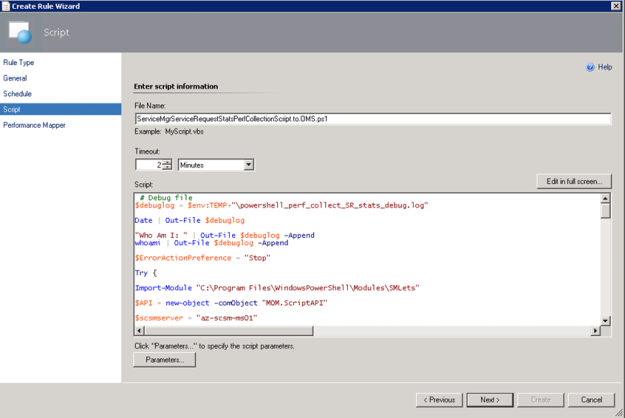
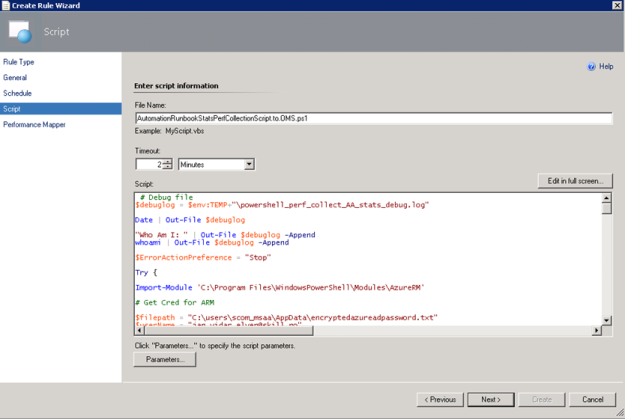
  4. Selecting a name for the script file and timeout, and entering the complete script as shown earlier:
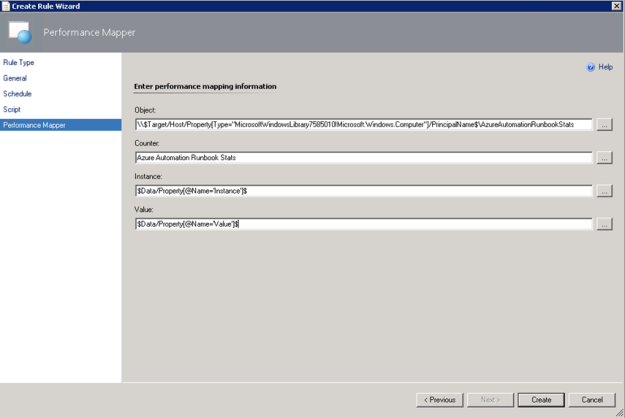
  5. For the Performance Mapping information, the Object name must be in the \\FQDN\YourObjectName format. For FQDN I used the Target variable for PrincipalName, and for the Object Name AzureAutomationRunbookStats, and adding the “\\” at the start and “\” between: \\$Target/Host/Property[Type=”MicrosoftWindowsLibrary7585010!Microsoft.Windows.Computer”]/PrincipalName$\AzureAutomationRunbookStatsI specified the Counter name as “Azure Automation Runbook Stats”, and the Instance and Value are specified as $Data/Property(@Name=’Instance’)$ and $Data/Property(@Name=Value)$. These reflect the PropertyBag instance and value created in the PowerShell script:
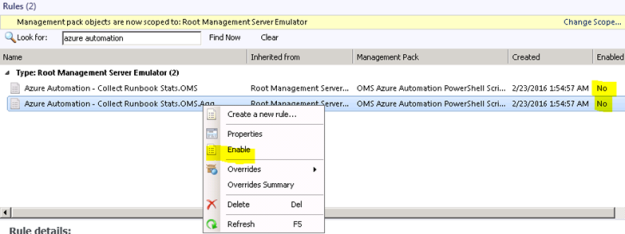
  6. After finishing the Create Rule Wizard, two new rules are created, which you can find by scoping to the Root Management Server Emulator I chose as target. Both Rules must be enabled, as they are not enabled by default:
At this point we are finished configuring the SCOM side, and can wait for some hours to see that data are actually coming into my OMS workspace.

Looking at Azure Automation Runbook Stats Performance Data in OMS

After a while I will start seeing Performance Data coming into OMS with the specified Object and Counter Name, and for the different instances and values.
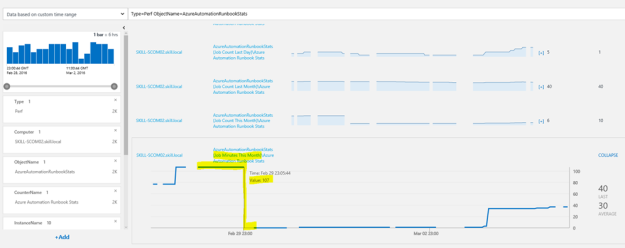
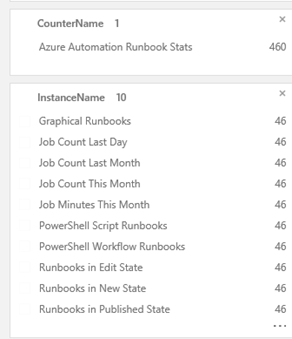
In Log Search, I can specify Type=Perf ObjectName=AzureAutomationRunbookStats, and I will find the Results and Metrics for the specified time frame.

In the example above I’m highlighting the Job Minutes This Month counter, which will steadily increase for each month, and as we can see the highest value was 107 minutes, after when the month changed to March we were back at 0 minutes. After a while when the number of job minutes increases it will be interesting to follow whether this counter will go close to 500 minutes.

This way, I can now look at Azure Automation Runbook stats as performance data, showing different scenarios like how many jobs and runbook job minutes there are over a time period. I can also look at how what type of runbooks I have and what state they are in.

I can also create saved searches and alerts for my search criteria.

Creating OMS Alerts for Azure Automation Runbook Counters

There is one specific scenario for Alerts I’m interested in, and that is when I’m approaching my monthly limit on 500 job minutes.

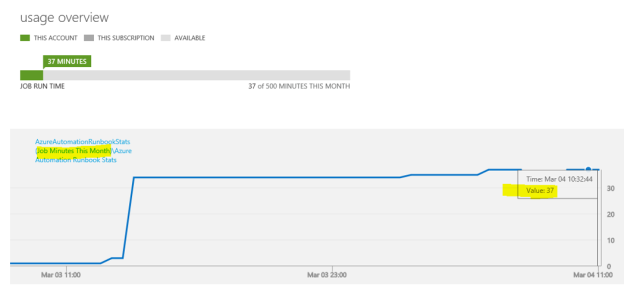
“Job Minutes This Month” is a counter that will get the sum of all job minutes for all runbook jobs across all automation accounts. In the classic Azure portal, you will have a usage overview like this:
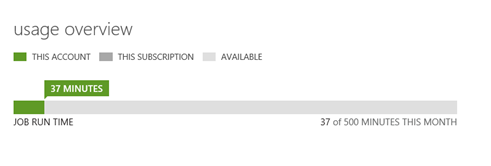
With OMS I would get this information over a time period like this:

The search query for Job Minutes This Month as I have defined it via the PowerShell Script Rule in OMS is:

Type=Perf ObjectName=AzureAutomationRunbookStats InstanceName=”Job Minutes This Month”

This would give me all results for the defined time period, but to generate an alert I would want to look at the most recent results, for example for the last hour. In addition, I want to filter the results for my alert when the number of job minutes are over the threshold of 450 which means I’m getting close to the limit of 500 free minutes per month. My query for this would be:

Type=Perf ObjectName=AzureAutomationRunbookStats InstanceName=”Job Minutes This Month” AND TimeGenerated>NOW-1HOUR AND CounterValue > 450

Now, in my test environment, this will give med 0 results, because I’m currently at 37 minutes:

Let’s say, for sake of testing an Alert, I add criteria to include 37 minutes as well, like this:
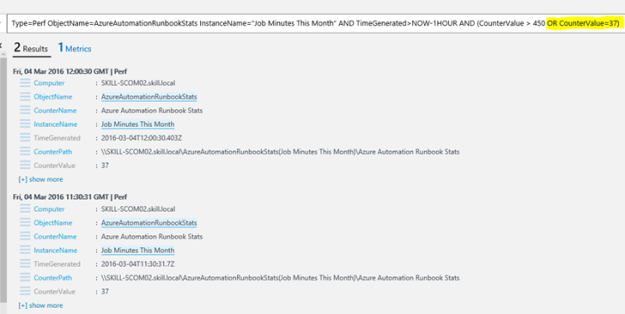
This time I have 2 results. Let’s create an alert for this, press the ALERT button:

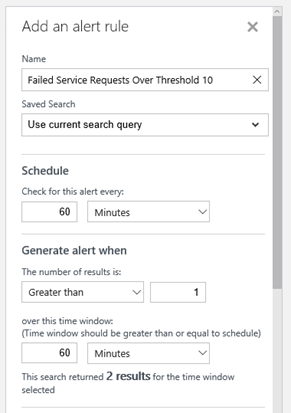
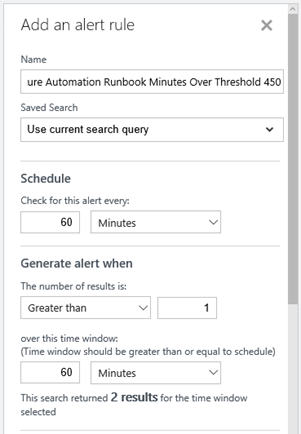
For the alert I give it a name and base it on the search query. I want to check every 60 minutes, and generate alert when the number of results is greater than 1 so that I make sure the passing of the threshold is consistent and not just temporary.
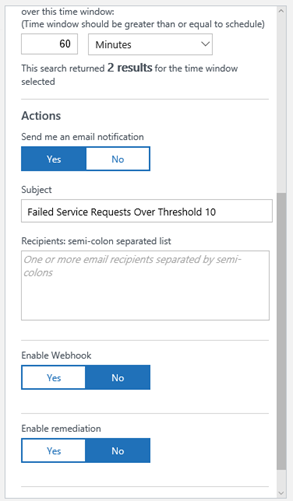
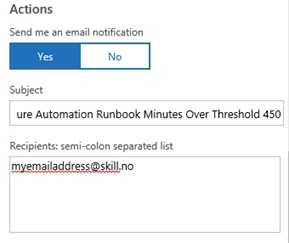
For actions I want an email notification, so I type in a Subject and my recipients.
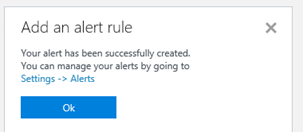
I Save the alert rule, and verify that it was successfully created.

Soon I get my first alert on email:
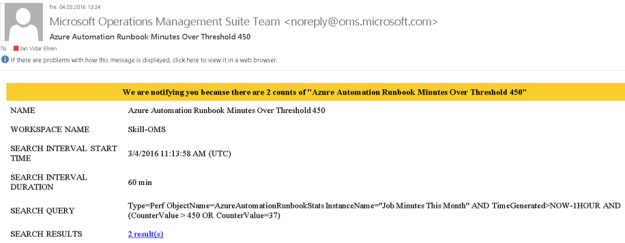
Now, that it works, I can remove the Alert and create a new one without the OR CounterValue=37, this I leave to you 😉

With that, this blog post is concluded. Thanks for reading, I hope this post on how to get more insights on your Azure Automation Runbook Stats in OMS and getting data via NRT Perfomance Collection has been useful 😉

Displaying Service Manager Service Requests Stats in OMS via Performance Collection and Operations Manager

Following up on my previous blog article on how to collect Service Manager and Incident statistics via Operations Manager to OMS, https://systemcenterpoint.wordpress.com/2016/02/19/collecting-service-manager-incident-stats-in-oms-via-powershell-script-performance-collection-in-operations-manager/, this blog article will show how to get statistics for Service Requests and display that as Performance Data in OMS.

Getting Ready

Please see the link above for the first article on getting SCSM data to OMS, and instructions for configuring your Operations Manager environment and SMLets PowerShell module. I will use that same setup as basis for this article.

Creating the PowerShell Command Script for getting SCSM Service Request data

First I needed to think about what kind of Service Request data I wanted to get from SCSM. I decided to get the following values:

  • Submitted Service Requests
  • In Progress Service Requests
  • Completed Service Requests
  • Failed Service Requests
  • Cancelled Service Requests
  • Closed Service Requests
  • Service Requests Opened Last Day
  • Service Requests Opened Last Hour
  • Service Requests Completed Last Day
  • New Service Requests

Now, first some thoughts on why I chose these data to get for Service Requests (SR). When New Service Requests are created, they are quickly changed to a status of either Submitted (no activities in the template the Service Request was created from) or In Progress (where there are one or more activities). SR’s with no activities are manually set to Completed by the analyst when finished, or Cancelled if the SR will not be delivered. SR’s with activities gets the status Completed when all activities are completed as well, but might also get the status of Failed if any activities fails as well, for example runbook automation activities that might fail. Finally, when SR’s are completed, they will eventually be Closed.

So it makes sense to track all these statuses as performance data. You might ask why look at New status for SR’s, when this is only an intermittent status quickly changing to either Submitted or In Progress? Well, if there is a problem with the Workflow service at the Service Manager Management Server, SR’s can be stuck in New status. This is something I would want to be able to see in OMS, and even create an Alert for.

In addition to tracking the individual status values, I also want to see data on how many SR’s are created the last day, last hour, and also how many SR’s are Completed the last day. These will be nice performance indicators.

These Service Request values will be retrieved by the Get-SCSMObject cmdlet in SMLets, using different criteria. Unlike Get-SCSMIncident which query directly for Incident Records, I have to create the PowerShell command a little bit different, by specifying the Class Object (via Get-SCSMClass) and also filter Status Enumeration Id for Service Requests via Get-SCSMEnumeration. For example to get all SR’s with a status of In Progress, I use the following command:

The complete script is shown below for how to get those SR data via SCOM to OMS:

# Debug file
$debuglog = $env:TEMP+\powershell_perf_collect_SR_stats_debug.log

Date | Out-File $debuglog

Who Am I: | Out-File $debuglog -Append
whoami |
Out-File $debuglog -Append

$ErrorActionPreference = Stop

Try {

Import-Module C:\Program Files\WindowsPowerShell\Modules\SMLets

$API = new-object -comObject MOM.ScriptAPI

$scsmserver = az-scsm-ms01

$beforetime = $(Get-Date).AddHours(1)
$beforedate = $(Get-Date).AddDays(1)

$PropertyBags=@()

$inprogressrequests = 0
$inprogressrequests = @(Get-SCSMObject -Computername $scsmserver –Class (Get-SCSMClass -ComputerName $scsmserver -Name System.WorkItem.ServiceRequest$) -Filter (Status -eq ‘ + (Get-SCSMEnumeration -ComputerName $scsmserver ServiceRequestStatusEnum.InProgress$).Id +)).Count
$PropertyBag = $API.CreatePropertyBag()
$PropertyBag.AddValue(Instance, In Progress Service Requests)
$PropertyBag.AddValue(Value, [UInt32]$inprogressrequests)
$PropertyBags += $PropertyBag

In Progress Service Requests: | Out-File $debuglog -Append
$inprogressrequests | Out-File $debuglog -Append

$completedrequests = 0
$completedrequests = @(Get-SCSMObject -Computername $scsmserver –Class (Get-SCSMClass -ComputerName $scsmserver -Name System.WorkItem.ServiceRequest$) -Filter (Status -eq ‘ + (Get-SCSMEnumeration -ComputerName $scsmserver ServiceRequestStatusEnum.Completed$).Id +)).Count
$PropertyBag = $API.CreatePropertyBag()
$PropertyBag.AddValue(Instance, Completed Service Requests)
$PropertyBag.AddValue(Value, [UInt32]$completedrequests)
$PropertyBags += $PropertyBag

Completed Service Requests: | Out-File $debuglog -Append
$completedrequests | Out-File $debuglog -Append

$submittedrequests = 0
$submittedrequests = @(Get-SCSMObject -Computername $scsmserver –Class (Get-SCSMClass -ComputerName $scsmserver -Name System.WorkItem.ServiceRequest$) -Filter (Status -eq ‘ + (Get-SCSMEnumeration -ComputerName $scsmserver ServiceRequestStatusEnum.Submitted$).Id +)).Count
$PropertyBag = $API.CreatePropertyBag()
$PropertyBag.AddValue(Instance, Submitted Service Requests)
$PropertyBag.AddValue(Value, [UInt32]$submittedrequests)
$PropertyBags += $PropertyBag

Submitted Service Requests: | Out-File $debuglog -Append
$submittedrequests | Out-File $debuglog -Append

$cancelledrequests = 0
$cancelledrequests = @(Get-SCSMObject -Computername $scsmserver –Class (Get-SCSMClass -ComputerName $scsmserver -Name System.WorkItem.ServiceRequest$) -Filter (Status -eq ‘ + (Get-SCSMEnumeration -ComputerName $scsmserver ServiceRequestStatusEnum.Canceled$).Id +)).Count
$PropertyBag = $API.CreatePropertyBag()
$PropertyBag.AddValue(Instance, Cancelled Service Requests)
$PropertyBag.AddValue(Value, [UInt32]$cancelledrequests)
$PropertyBags += $PropertyBag

Cancelled Service Requests: | Out-File $debuglog -Append
$cancelledrequests | Out-File $debuglog -Append

$failedrequests = 0
$failedrequests = @(Get-SCSMObject -Computername $scsmserver –Class (Get-SCSMClass -ComputerName $scsmserver -Name System.WorkItem.ServiceRequest$) -Filter (Status -eq ‘ + (Get-SCSMEnumeration -ComputerName $scsmserver ServiceRequestStatusEnum.Failed$).Id +)).Count
$PropertyBag = $API.CreatePropertyBag()
$PropertyBag.AddValue(Instance, Failed Service Requests)
$PropertyBag.AddValue(Value, [UInt32]$failedrequests)
$PropertyBags += $PropertyBag

Failed Service Requests: | Out-File $debuglog -Append
$failedrequests | Out-File $debuglog -Append

$closedrequests = 0
$closedrequests = @(Get-SCSMObject -Computername $scsmserver –Class (Get-SCSMClass -ComputerName $scsmserver -Name System.WorkItem.ServiceRequest$) -Filter (Status -eq ‘ + (Get-SCSMEnumeration -ComputerName $scsmserver ServiceRequestStatusEnum.Closed$).Id +)).Count
$PropertyBag = $API.CreatePropertyBag()
$PropertyBag.AddValue(Instance, Closed Service Requests)
$PropertyBag.AddValue(Value, [UInt32]$closedrequests)
$PropertyBags += $PropertyBag

Closed Service Requests: | Out-File $debuglog -Append
$closedrequests | Out-File $debuglog -Append

$newrequests = 0
$newrequests = @(Get-SCSMObject -Computername $scsmserver –Class (Get-SCSMClass -ComputerName $scsmserver -Name System.WorkItem.ServiceRequest$) -Filter (Status -eq ‘ + (Get-SCSMEnumeration -ComputerName $scsmserver ServiceRequestStatusEnum.New$).Id +)).Count
$PropertyBag = $API.CreatePropertyBag()
$PropertyBag.AddValue(Instance, New Service Requests)
$PropertyBag.AddValue(Value, [UInt32]$newrequests)
$PropertyBags += $PropertyBag

New Service Requests: | Out-File $debuglog -Append
$newrequests | Out-File $debuglog -Append

$requestsopenedlasthour = 0
$requestsopenedlasthour = @(Get-SCSMObject -Computername $scsmserver –Class (Get-SCSMClass -ComputerName $scsmserver -Name System.WorkItem.ServiceRequest$) -Filter (CreatedDate -gt ‘ + $beforetime +)).Count
$PropertyBag = $API.CreatePropertyBag()
$PropertyBag.AddValue(Instance, Service Requests Opened Last Hour)
$PropertyBag.AddValue(Value, [UInt32]$requestsopenedlasthour)
$PropertyBags += $PropertyBag

Service Requests Opened Last Hour: | Out-File $debuglog -Append
$requestsopenedlasthour | Out-File $debuglog -Append

$requestsopenedlastday = 0
$requestsopenedlastday = @(Get-SCSMObject -Computername $scsmserver –Class (Get-SCSMClass -ComputerName $scsmserver -Name System.WorkItem.ServiceRequest$) -Filter (CreatedDate -gt ‘ + $beforedate +)).Count
$PropertyBag = $API.CreatePropertyBag()
$PropertyBag.AddValue(Instance, Service Requests Opened Last Day)
$PropertyBag.AddValue(Value, [UInt32]$requestsopenedlastday)
$PropertyBags += $PropertyBag

Service Requests Opened Last Day: | Out-File $debuglog -Append
$requestsopenedlastday | Out-File $debuglog -Append

$requestscompletedlastday = 0
$requestscompletedlastday = @(Get-SCSMObject -Computername $scsmserver –Class (Get-SCSMClass -ComputerName $scsmserver -Name System.WorkItem.ServiceRequest$) -Filter (CompletedDate -gt ‘ + $beforedate +)).Count
$PropertyBag = $API.CreatePropertyBag()
$PropertyBag.AddValue(Instance, Service Requests Completed Last Day)
$PropertyBag.AddValue(Value, [UInt32]$requestscompletedlastday)
$PropertyBags += $PropertyBag

Service Requests Completed Last Day: | Out-File $debuglog -Append
$requestscompletedlastday | Out-File $debuglog -Append

$PropertyBags

} Catch {

Error Catched: | Out-File $debuglog -Append
$(
$_.Exception.GetType().FullName) | Out-File $debuglog -Append
$(
$_.Exception.Message) | Out-File $debuglog -Append

}


PS! I have included debugging and logging in the script, be aware though that doing $ErrorActionPreference=Stop will end the script if any errors, for example with logging, so it might be an idea to remove the debug logging when confirmed that everything works.

In the next part I’m ready to create the PowerShell Script Rule.

Creating the PowerShell Script Rule

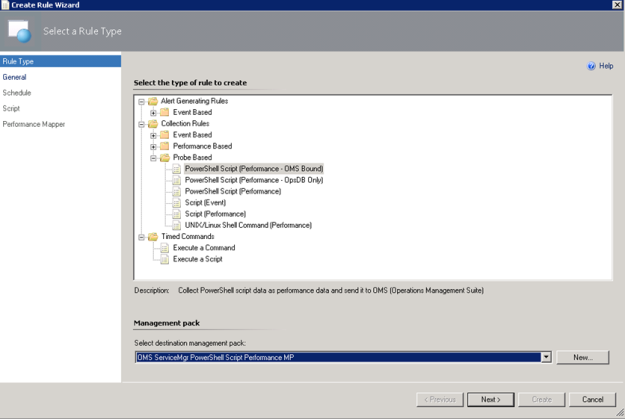
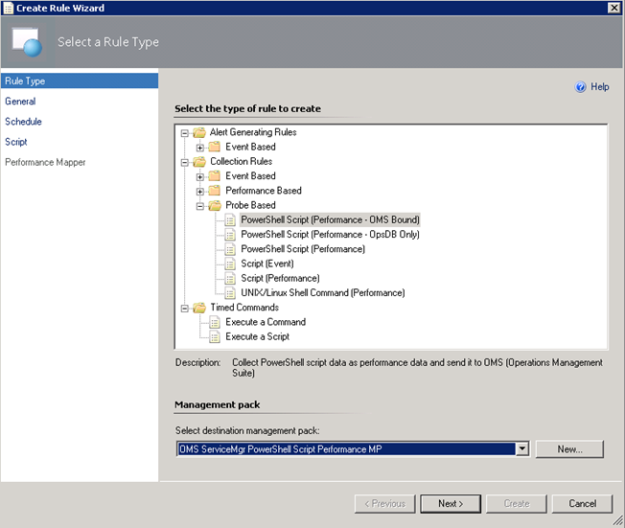
In the Operations Console, under Authoring, create a new PowerShell Script Rule as shown below:

    1. Select the PowerShell Script (Performance – OMS Bound) Rule:I have created a custom destination management pack for this script.
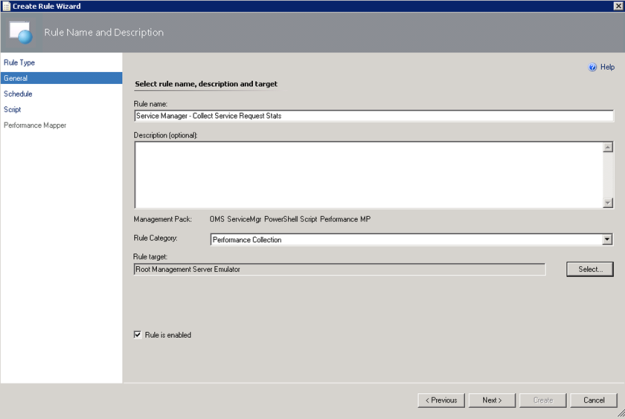
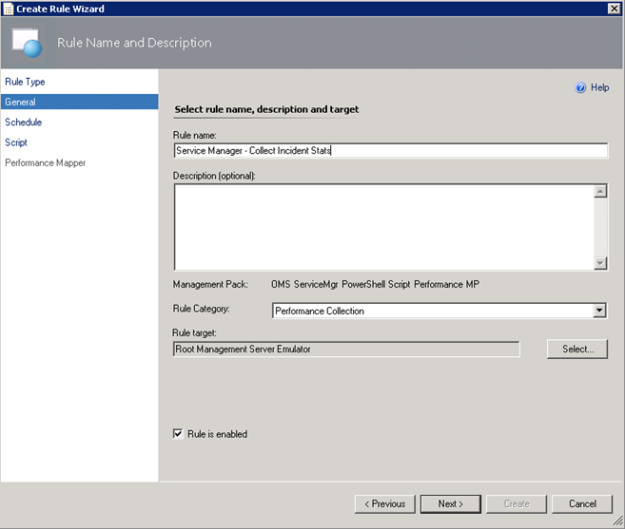
    2. Specifying a Rule name and Rule Category: Performance Collection. As mentioned earlier in this article the Rule target will be the Root Management Server Emulator:
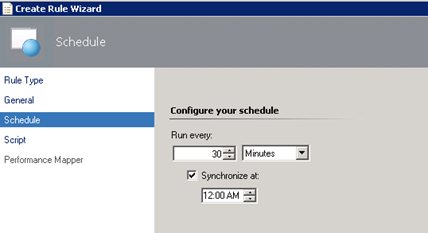
    3. Selecting to run the script every 30 minutes, and at which time the interval will start from:
    4. Selecting a name for the script file and timeout, and entering the complete script as shown earlier:
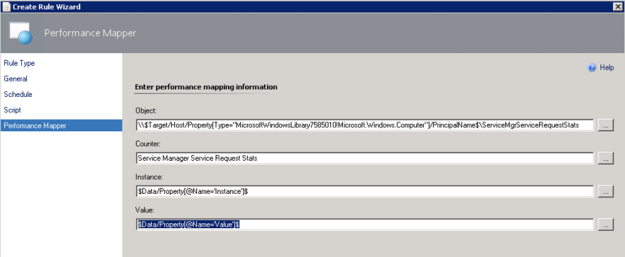
    5. For the Performance Mapping information, the Object name must be in the \\FQDN\YourObjectName format. For FQDN I used the Target variable for PrincipalName, and for the Object Name ServiceManagerServiceRequestStats, and adding the “\\” at the start and “\” between: \\$Target/Host/Property[Type=”MicrosoftWindowsLibrary7585010!Microsoft.Windows.Computer”]/PrincipalName$\ServiceMgrServiceRequestStatsI specified the Counter name as “Service Manager Service Request Stats”, and the Instance and Value are specified as $Data/Property(@Name=’Instance’)$ and $Data/Property(@Name=Value)$. These reflect the PropertyBag instance and value created in the PowerShell script:
    6. After finishing the Create Rule Wizard, two new rules are created, which you can find by scoping to the Root Management Server Emulator I chose as target. Both Rules must be enabled, as they are not enabled by default:


At this point we are finished configuring the SCOM side, and can wait for some hours to see that data are actually coming into my OMS workspace.

Looking at Service Manager Service Request Performance Data in OMS

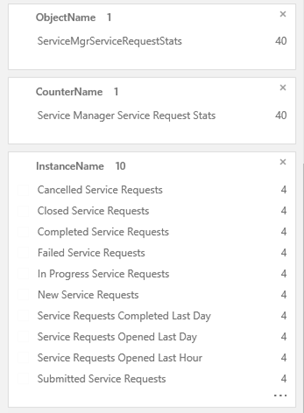
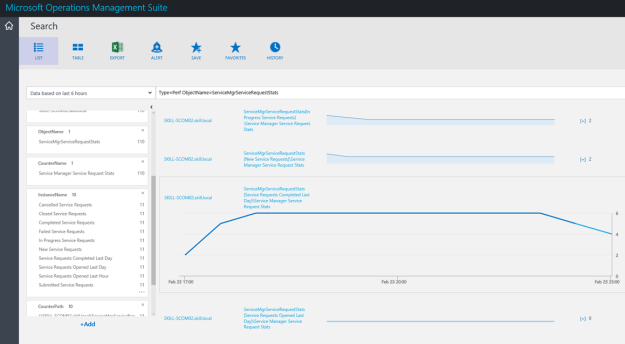
After a while I will start seeing Performance Data coming into OMS with the specified Object and Counter Name, and for the different instances and values.

In Log Search, I can specify Type=Perf ObjectName=ServiceMgrServiceRequestStats, and I will find the Results and Metrics for the specified time frame.

I can now look at Service Manager stats as performance data, showing different scenarios like how many active, pending, resolved and closed incidents there are over a time period. I can also look at how many incidents are created by each hour or by each day.

I can also create saved searches and alerts for my search criteria.

Creating OMS Alerts for Service Request Counters

A couple of scenarios are interesting for Alerts when some of the Service Request counters pass a threshold.

Failed Service Requests is a status that will be set when an Activity in the SR fails, for example a Runbook Automation Activity. Normally you would expect that analysts would follow up on requests that fails directly in Service Manager, but it could make sense to generate an alert if the number of failed requests increases over a predefined threshold.

The search query for Failed Service Requests in OMS is:

Type=Perf ObjectName=ServiceMgrServiceRequestStats InstanceName=”Failed Service Requests”

This would give me all results for the defined time period, but to generate an alert I would want to look at the most recent results, for example for the last hour. In addition, I want to filter the results for my alert when the number of failed requests are over the threshold of 10. My query for this would be:

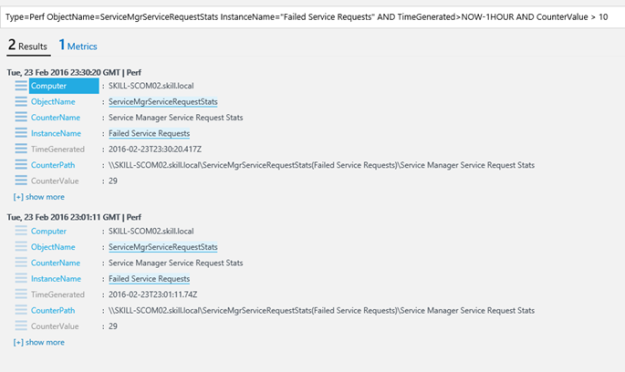
Type=Perf ObjectName=ServiceMgrServiceRequestStats InstanceName=”Failed Service Requests” AND TimeGenerated>NOW-1HOUR AND CounterValue > 10

In my test environment, this gives me the following result, showing that I have a total of 29 failed requests:

Ok, 29 failed requests are a lot, but as this is a test environment and a lot of these are old requests, I would need to do some cleaning up. I want to create an alert for this, so I press the Alert button:

For the alert I give it a name and base it on the search query. I want to check every 60 minutes, and generate alert when the number of results is greater than 1 so that I make sure the passing of the threshold is consistent and not just temporary.

For actions I want an email notification, so I type in a Subject and my recipients.

I Save the alert rule, and verify that it was successfully created.

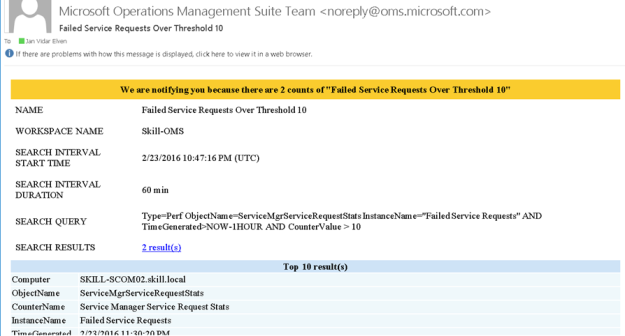
Soon I get my first alert on email:

There is also a second scenario for an alert, and that is when Service Requests get stuck in a New status. Normally this would be when Service Manager workflows are not running, so it will be important to get notified on that.

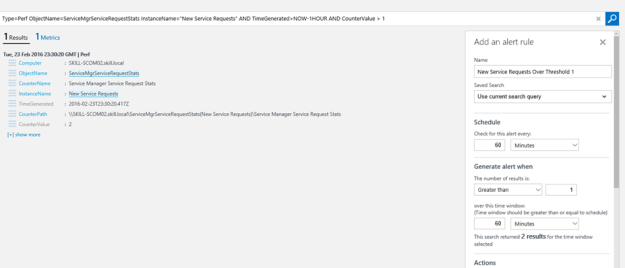
The following search query, using countervalue > 1 will provide the results for my alert as I want to get notified as soon there is more than one value in the results:

Type=Perf ObjectName=ServiceMgrServiceRequestStats InstanceName=”New Service Requests” AND TimeGenerated>NOW-1HOUR AND CounterValue > 1

And I can create my alert as the following image:

With that, this blog post is concluded. Thanks for reading, I hope the posts on OMS and getting SCSM data via NRT Perfomance Collection has been useful 😉

Collecting Service Manager Incident Stats in OMS via PowerShell Script Performance Collection in Operations Manager

I have been thinking about bringing in some key Service Manager statistics to Microsoft Operations Management Suite. The best way to do that now is to use the NRT Performance Data Collection in OMS and PowerShell Script rule in my Operations Manager Management Group that I have connected to OMS. The key solution to make this happen are the “Sample Management Pack – Wizard to Create PowerShell script Collection Rules” described in this blog article http://blogs.msdn.com/b/wei_out_there_with_system_center/archive/2015/09/29/oms-collecting-nrt-performance-data-from-an-opsmgr-powershell-script-collection-rule-created-from-a-wizard.aspx.

With this solution I can practically get any data I want into OMS via SCOM and PowerShell Script, so I will start my solution for bringing in Service Manager Stats by defining some PowerShell commands to get the values I want. For that I will use the SMLets PowerShell Module for Service Manager.

For this blog article, I will focus on Incident Stats from SCSM. In a later article I will get in some more SCSM data to OMS.

Getting Ready

I have to do some preparations first. This includes:

  1. Importing the “Sample Management Pack – Wizard to Create PowerShell script Collection Rules”
    1. This can be downloaded from Technet Gallery at https://gallery.technet.microsoft.com/Sample-Management-Pack-e48040f7
  2. Install the SMLets for SCSM PowerShell Module (at the chosen Target server for the PowerShell Script Rule).
    1. I chose to install it from the PowerShell Gallery at https://www.powershellgallery.com/packages/SMLets
    2. If you are running Windows Server 2012 R2, which I am, follow the instructions here to support the PowerShellGet module, https://www.powershellgallery.com/GettingStarted?section=Get%20Started.
  3. Choose Target for where to run the SCSM commands from
    1. Regarding the SMLets and where to install, I decided to use the SCOM Root Management Server Emulator. This server will then run the SCSM commands against the Service Manager Management Server.
  4. Choose account for Run As Profile
    1. I also needed to think about the run as account the SCSM commands will run under. As we will see later the PowerShell Script Rules will be set up with a Default Run As Profile.
    2. The Default Run As Profile for the RMS Emulator will be the Management Server Action Account, if I had chosen another Rule Target the Default Run As Profile would be the Local System Account.
    3. Alternatively, I could have created a custom Run As Profile with a SCSM user account that have permissions to read the required data from SCSM, and configured the PowerShell Script rules to use that.
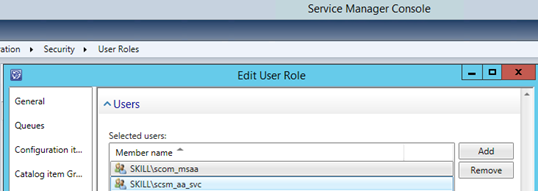
    4. I decided to go with the Management Server Action Account, and make sure that this account is mapped to a Role in SCSM with access to the work items I want to query against, any Operator Role will do but you could chose to scope and restrict more if needed:

At this point I’m ready for the next step, which is to create some PowerShell commands for the Script Rule in SCOM.

Creating the PowerShell Command Script for getting SCSM data

First I needed to think about what kind of Incident data I wanted to get from SCSM. I decided to get the following values:

  • Active Incidents
  • Pending Incidents
  • Resolved Incidents
  • Closed Incidents
  • Incidents Opened Last Day
  • Incidents Opened Last Hour

These values will be retrieved by the Get-SCSMIncident cmdlet in SMLets, using different criteria. The complete script is shown below:

# Debug file
$debuglog = $env:TEMP+\powershell_perf_collect_debug.log

Date | Out-File $debuglog

Who Am I: | Out-File $debuglog -Append
whoami |
Out-File $debuglog -Append

$ErrorActionPreference = Stop

Try {

Import-Module C:\Program Files\WindowsPowerShell\Modules\SMLets

$API = new-object -comObject MOM.ScriptAPI

$scsmserver = MY-SCSM-MANAGEMENTSERVER-HERE

$beforetime = $(Get-Date).AddHours(1)
$beforedate = $(Get-Date).AddDays(1)

$PropertyBags=@()

$activeincidents = 0
$activeincidents = @(Get-SCSMIncident -ComputerName $scsmserver -Status Active).Count
$PropertyBag = $API.CreatePropertyBag()
$PropertyBag.AddValue(Instance, Active Incidents)
$PropertyBag.AddValue(Value, [UInt32]$activeincidents)
$PropertyBags += $PropertyBag

Active Incidents: | Out-File $debuglog -Append
$activeincidents | Out-File $debuglog -Append

$pendingincidents = 0
$pendingincidents = @(Get-SCSMIncident -ComputerName $scsmserver -Status Pending).Count
$PropertyBag = $API.CreatePropertyBag()
$PropertyBag.AddValue(Instance, Pending Incidents)
$PropertyBag.AddValue(Value, [UInt32]$pendingincidents)
$PropertyBags += $PropertyBag

Pending Incidents: | Out-File $debuglog -Append
$pendingincidents | Out-File $debuglog -Append

$resolvedincidents = 0
$resolvedincidents = @(Get-SCSMIncident -ComputerName $scsmserver -Status Resolved).Count
$PropertyBag = $API.CreatePropertyBag()
$PropertyBag.AddValue(Instance, Resolved Incidents)
$PropertyBag.AddValue(Value, [UInt32]$resolvedincidents)
$PropertyBags += $PropertyBag

Resolved Incidents: | Out-File $debuglog -Append
$resolvedincidents | Out-File $debuglog -Append

$closedincidents = 0
$closedincidents = @(Get-SCSMIncident -ComputerName $scsmserver -Status Closed).Count
$PropertyBag = $API.CreatePropertyBag()
$PropertyBag.AddValue(Instance, Closed Incidents)
$PropertyBag.AddValue(Value, [UInt32]$closedincidents)
$PropertyBags += $PropertyBag

Closed Incidents: | Out-File $debuglog -Append
$closedincidents | Out-File $debuglog -Append

$incidentsopenedlasthour = 0
$incidentsopenedlasthour = @(Get-SCSMIncident -CreatedAfter $beforetime -ComputerName $scsmserver).Count
$PropertyBag = $API.CreatePropertyBag()
$PropertyBag.AddValue(Instance, Incidents Opened Last Hour)
$PropertyBag.AddValue(Value, [UInt32]$incidentsopenedlasthour)
$PropertyBags += $PropertyBag

Incidents Opened Last Hour: | Out-File $debuglog -Append
$incidentsopenedlasthour | Out-File $debuglog -Append

$incidentsopenedlastday = 0
$incidentsopenedlastday = @(Get-SCSMIncident -CreatedAfter $beforedate -ComputerName $scsmserver).Count
$PropertyBag = $API.CreatePropertyBag()
$PropertyBag.AddValue(Instance, Incidents Opened Last Day)
$PropertyBag.AddValue(Value, [UInt32]$incidentsopenedlastday)
$PropertyBags += $PropertyBag

Incidents Opened Last Day: | Out-File $debuglog -Append
$incidentsopenedlastday | Out-File $debuglog -Append

$PropertyBags

} Catch {

Error Catched: | Out-File $debuglog -Append
$(
$_.Exception.GetType().FullName) | Out-File $debuglog -Append
$(
$_.Exception.Message) | Out-File $debuglog -Append

}

Some comments about the script. I usually like to include some debug logging in the script when I develop the solution. This way I can keep track of what happens underway in the script or get some exceptions if the script command fails. Be aware though that doing $ErrorActionPreference=Stop will end the script if any errors, so it might be an idea to remove the debug logging when confirmed that everything works.

In the next part I’m ready to create the PowerShell Script Rule.

Creating the PowerShell Script Rule

In the Operations Console, under Authoring, create a new PowerShell Script Rule as shown below:

  1. Select the PowerShell Script (Performance – OMS Bound) Rule:I have created a custom destination management pack for this script.
  2. Specifying a Rule name and Rule Category: Performance Collection. As mentioned earlier in this article the Rule target will be the Root Management Server Emulator:
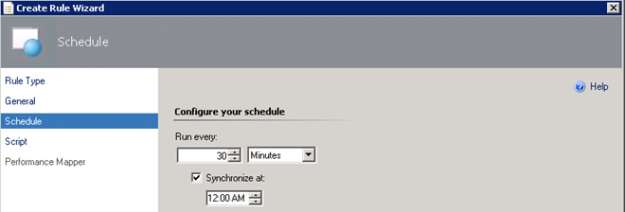
  3. Selecting to run the script every 30 minutes, and at which time the interval will start from:
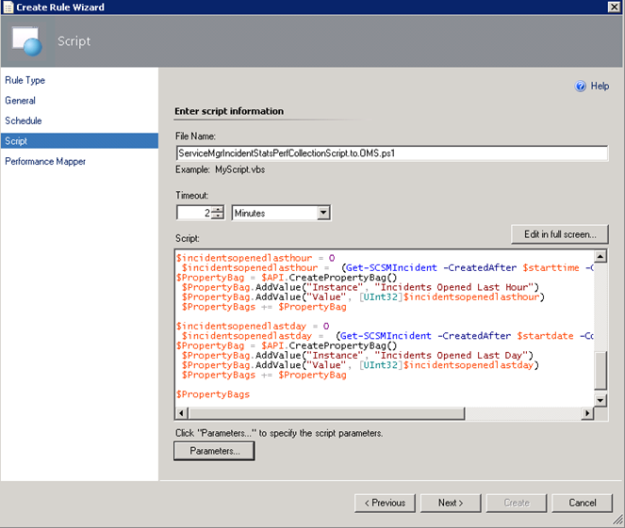
  4. Selecting a name for the script file and timeout, and entering the complete script as shown earlier:
  5. For the Performance Mapping information, the Object name must be in the \\FQDN\YourObjectName format. For FQDN I used the Target variable for PrincipalName, and for the Object Name ServiceManagerIncidentStats, and adding the “\\” at the start and “\” between: \\$Target/Host/Property[Type=”MicrosoftWindowsLibrary7585010!Microsoft.Windows.Computer”]/PrincipalName$\ServiceMgrIncidentStats I specified the Counter name as “Service Manager Incident Stats”, and the Instance and Value are specified as $Data/Property(@Name=’Instance’)$ and $Data/Property(@Name=Value)$. These reflect the PropertyBag instance and value created in the PowerShell script:
  6. After finishing the Create Rule Wizard, two new rules are created, which you can find by scoping to the Root Management Server Emulator I chose as target. Both Rules must be enabled, as they are not enabled by default:
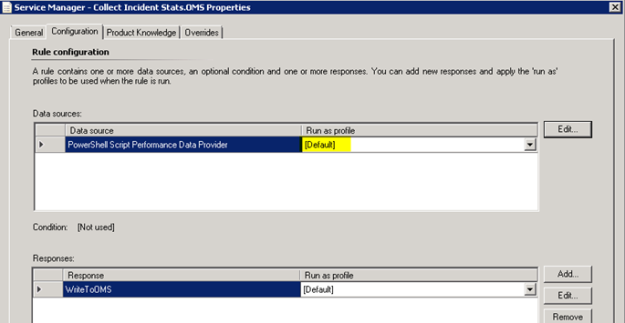
  7. Looking into the Properties of the rules, we can make edits to the PowerShell script, and verify that the Run as profile is the Default. This is where I would change the profile if I wanted to create my own custom profile and run as account for it.

At this point we are finished configuring the SCOM side, and can wait for some hours to see that data are actually coming into my OMS workspace.

Looking at Service Manager Performance Data in OMS

After a while I will start seeing Performance Data coming into OMS with the specified Object and Counter Name, and for the different instances and values.

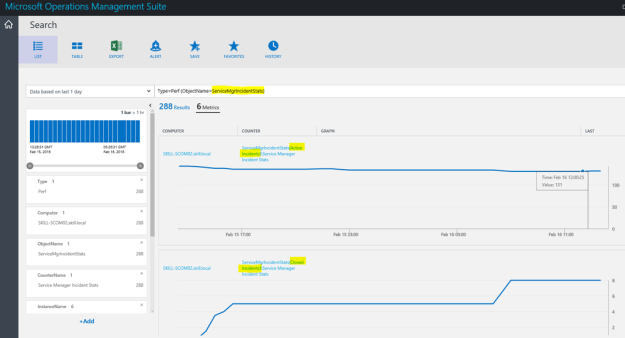
In Log Search, I can specify Type=Perf ObjectName=ServiceMgrIncidentStats, and I will find the Results and Metrics for the specified time frame.

I can now look at Service Manager stats as performance data, showing different scenarios like how many active, pending, resolved and closed incidents there are over a time period. I can also look at how many incidents are created by each hour or by each day.

Finally, I can also create saved searches and alerts that creates for example alerts when the number of incidents for any counters are over a set value.

Thanks for reading, and look for more blog posts on OMS and getting SCSM data via NRT Perfomance Collection in the future 😉

Publish Operations Management Suite Portal with Azure AD

To be able to access the Operations Management Suite Portal for your OMS workspace, you will need to have an account with either administrator or user access to the workspace.

This could be a Microsoft Account, or if you have added an Azure Active Directory Organization to your OMS workspace, you can add Azure users or groups to your workspace.

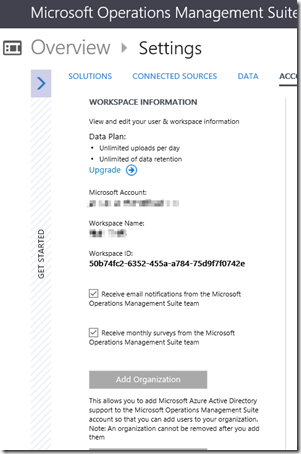
add organization

When users from your Azure AD has been granted either administrator or user access to the OMS workspace, you can notify them that they can log on to the portal.

But, where should they go to log in? The simplest way could be to tell them to go to http://www.microsoft.com/oms, and hit the Sign In link at the top. After signing in they will be instructed to choose the OMS workspace and then be directed to the OMS portal.

Another method is to tell them the workspace url for the portal directly. This would be something like: https://<workspaceid>.portal.mms.microsoft.com/#Workspace/overview/index

You will find the Workspace ID under Settings, and sometimes you can also use the Workspace Name in the above URL as well.

image

So you can communicate to users in your organization one of the methods above on how to access the portal. Chances are that most users will forget this info after a short while. They will either search after your e-mail, or ask you again at some time.

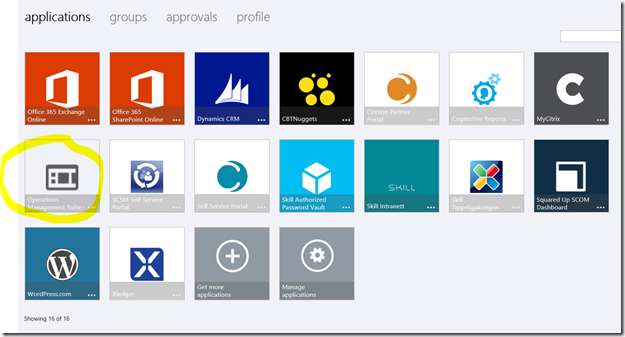
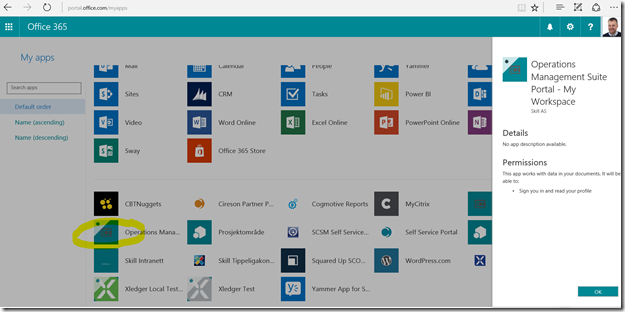
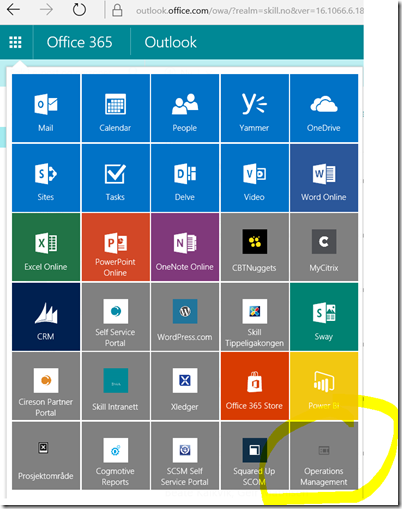
In this blog post I will show how you can publish the Operations Management Suite Portal as an Azure AD Application, utilizing Single Sign-On, so that users can access it easily with My Apps or the App Launcher in Office 365!

Step 1 – Add Organizational User or Group Accounts to OMS Workspace

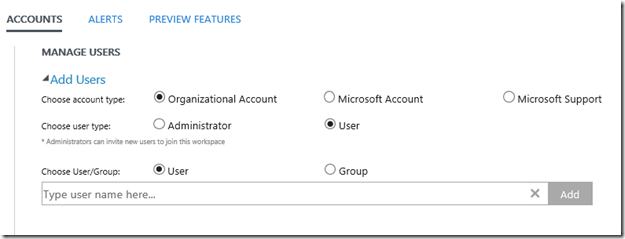
First you will need to add the Azure AD User or Group Account to your OMS Workspace. Select account type Organizational Account, and if they should be users or administrators. In the Choose User/Group type in and search for the users or groups you want to add:

image

Step 2 – Creating the Azure AD Application

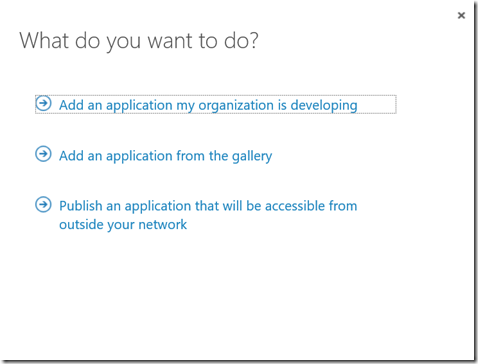
Next, log on as an Azure AD Global Administrator to the classic Azure management portal (manage.windowsazure.com). Under Active Directory, select your Azure AD, and then select Applications. Select Add to start adding a new Application. Select to Add an application my organization is developing:

image

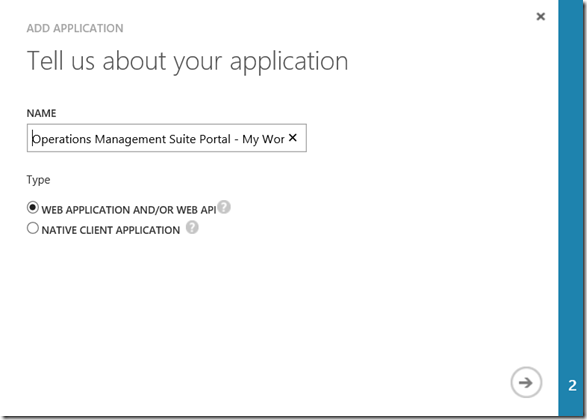
Next, specify a name for the application, and type of web application:

image

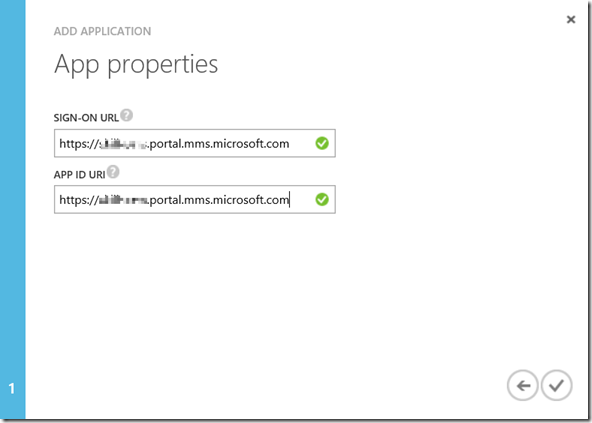
Specify URL for SIGN-ON and APP ID UR. This will be the OMS Portal url. using either workspace name or ID which you have discovered before:

image

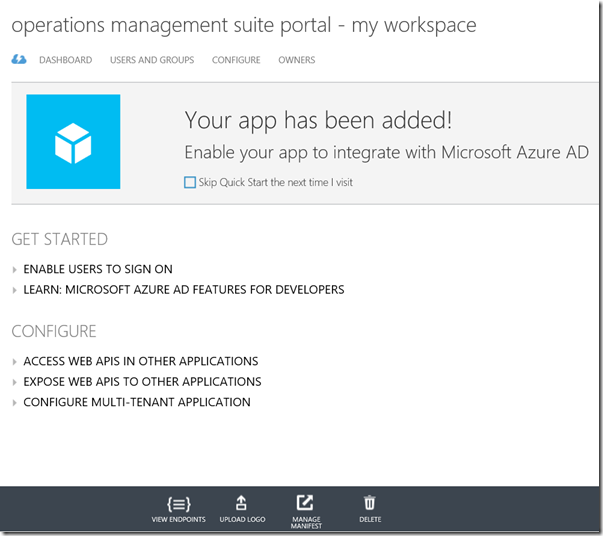
Finishing that and the Application has been added to Azure AD:

image

Step 3 – Adding Users and Groups to the Application

Next I need to add which Users or Groups that will see the published application. At the Users and Groups page for my application, I’m notified that user assignment are not currently required to access Operations Management Suite Portal. That is correct, because users can access the portal directly if they know the URL or sign in at the Microsoft OMS site.

Adding Users or Groups here will enable the application to be visible for the users at the My Apps / App Launcher:

image

I search for and select to Assign the Groups (or Users) I want to have the application visible for.

Step 4 – Logo and optional configuration

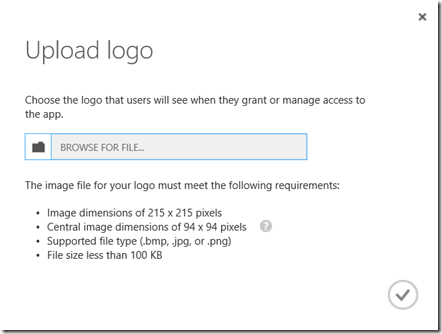
After adding users, the application is ready to test, but first I would want to add my own logo.

image

In this example I’m using a transparent png image with dimensions 215×215, and a central image dimension of 94×94.

image

image

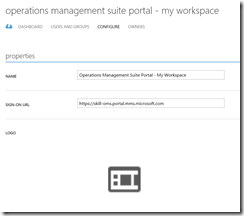
At the Configure page, other settings can be set such as requiring user assignment, access rules with Multi-Factor Authentication and Self-Service access for users that has not been specifically assigned access.

I this scenario I only wanted to get the application published to users, so I will not configure any more settings. We are ready to test.

Part 5 – User Access to the Published Application

Users can now access My Apps at https://myapps.microsoft.com. When logging in with the Azure AD User a list of published applications will be visible, and I can see the OMS Portal Application:

image

And, logged in to Office 365, I can select the App Launcher and show all my apps at https://portal.office.com/myapps.

image

I can pin the application to the App Launcher if I want for quicker access.

image

So to conclude this blog post, users now have a quickly accessible shortcut to the Operations Management Suite Portal using single sign-on with Azure AD.

Creating SCSM Incidents from OMS Alerts using Azure Automation – Part 2

This is the second part of a 2-part blog article that will show how you can create a new Service Manager Incident from an Azure Automation Runbook using a Hybrid Worker Group, and with OMS Alerts search for a condition and generate an alert which triggers this Azure Automation Runbook for creating an Incident in Service Manager via a Webhook and some contextual data for the Alert.

In Part 1 of the blog I prepared my Service Manager environment, and created Azure Automation Runbook and Assets to run via Hybrid Worker for generating incidents in Service Manager. In this second part of the blog I will configure my Operations Management Suite environment for OMS Alerting and Alert Remediation, and create an OMS Alert that will trigger this PowerShell Runbook.

Configuring OMS Alerting and Remediation

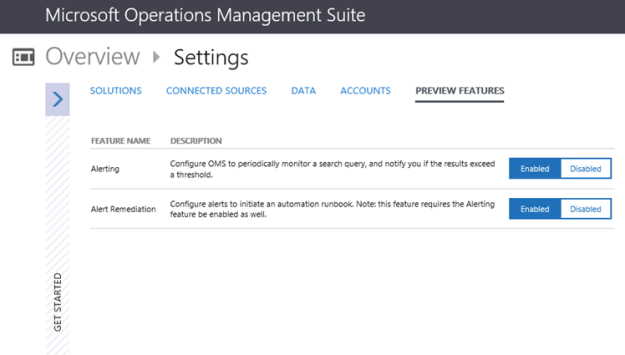
If you haven’t already for your OMS Workspace, you will need to enable the OMS Alerting and Alert Remediation under Settings and Preview Features. This is shown in the picture below:

Creating the OMS Alert

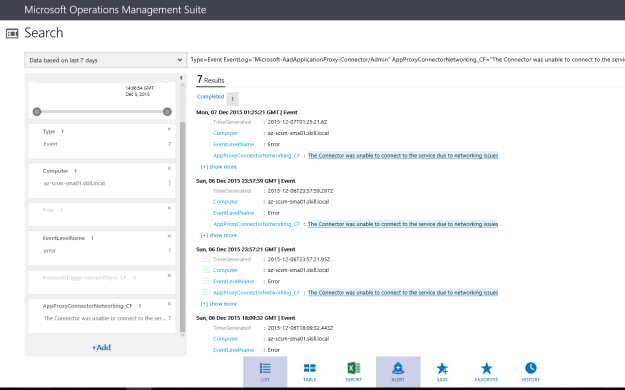
The next step is to create the OMS Alert. To do this I will need to do a Log Search with the criteria I want. For my example in this article, I will use an EventLog Search where I have previously added Azure AD Application Proxy Connector Event Log to OMS, and where I also have created a custom field for events where “The Connector was unable to connect to the service due to networking issues”.

The result of this Log Search is shown below, where I have 7 results in the last 7 days:

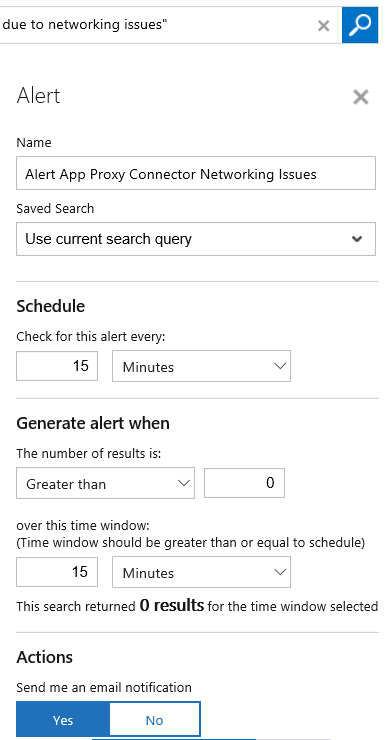
When I enabled OMS Alerting and Remediation under Settings, I can now see that I have a new Alert button at the bottom of the screen. I click on that to create my new OMS Alert.

I give the OMS Alert a descriptive name, using my current search query, and checking every 15 minutes for this alert. I can also specify a threshold over a specified time windows, in this case I want the Alert to trigger if there are more than 0 occurrences. If I want to I can also send an email notification to specified recipient(s).

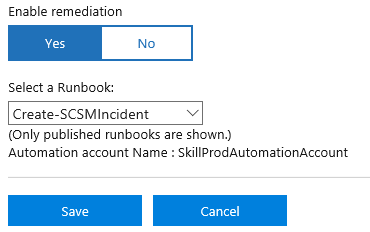
Since I want to generate a SCSM Incident when this OMS Alert triggers, I select to Enable Remediation and select my Create-SCSMIncident Runbook.

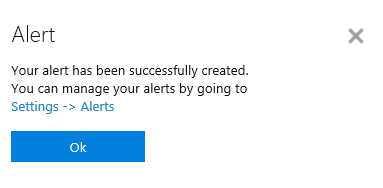
After saving the OMS Alert I get a successful confirmation, and a link to where I can see my configured Alerts:

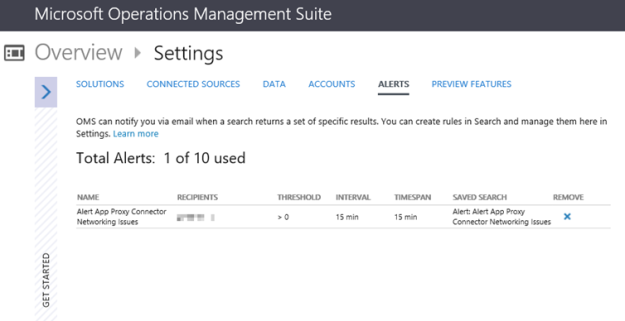
While in Preview I can only create up to 10 Alerts, and I can also remove them but not edit existing for now:

That is all I need to configure in Operations Management Suite to get the OMS Alert to trigger. Now I need to go back to the Azure Portal and configure some changes for my PowerShell Runbook!

Configuring Azure Automation PowerShell Runbook for Webhook and Hybrid Worker Group

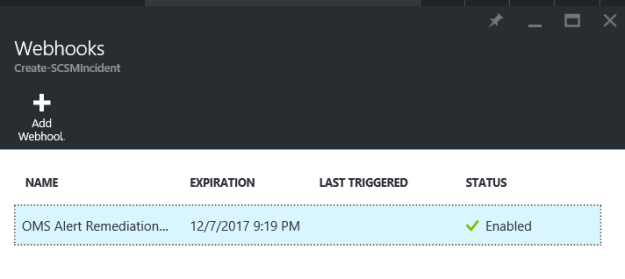
In the Azure Portal and under my Automation Account and the PowerShell Runbook I created for Create-SCSMIncident (see Part 1), there will now automatically be created a Webhook for OMS Alert Remediation. This Webhook has a expiry date of one year ahead of creation.

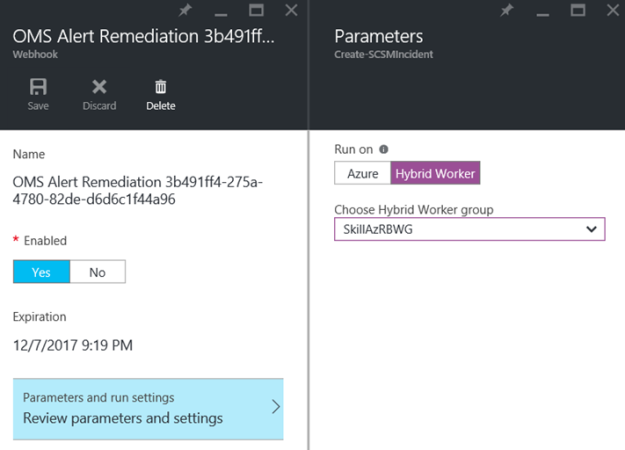
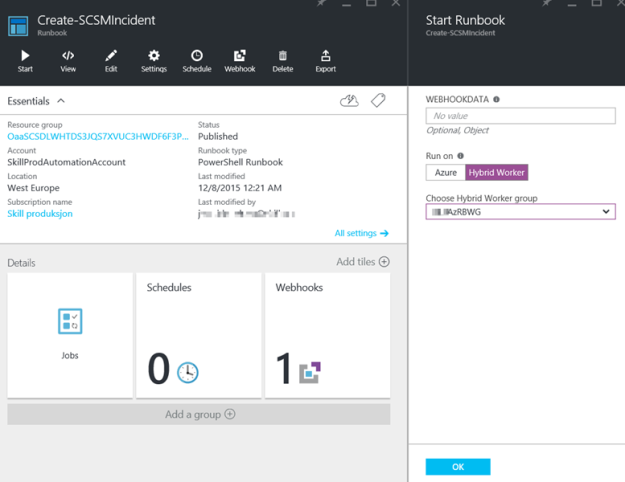
I now need to specify the Parameters for the Webhook, so that it runs on my Hybrid Worker group:

After I have specified the Hybrid Worker group, any OMS Alerts will now trigger this Runbook and run on my local environment, and in this case create the SCSM incident as specified in the PowerShell Runbook. But, I also want to have some contextual data in the Incident, so I need to look at the Webhook data in the next step.

Configuring and using Webhook for contextual data in Runbook

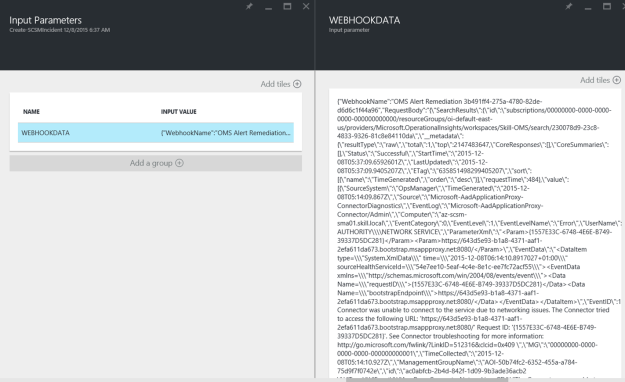
Whenever the OMS Alert triggers the remediation Azure Automation Runbook via the Webhook, event information will be submitted from OMS to the Runbook via WebhookData input parameter.

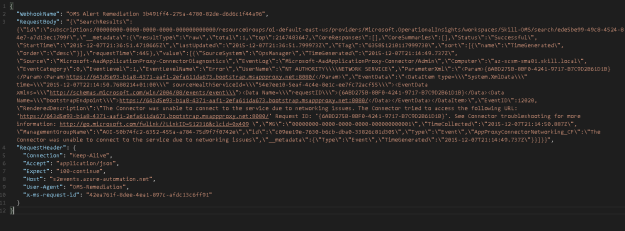
An example of this is shown in the image below, where the WebhookData Input Parameter contains event information formatted as JSON (JavaScript Object Notation):

So, I need to configure my PowerShell Runbook to process this WebhookData, and to use that information when creating the Incident.

Let’s first take a look at the WebhookData. If I copy the input from above to for example Visual Studio Code, I can see clearer that the WebhookData consists of a WebhookName, RequestBody and RequestHeader. The values I’m looking for are in the RequestBody and SearchResults:

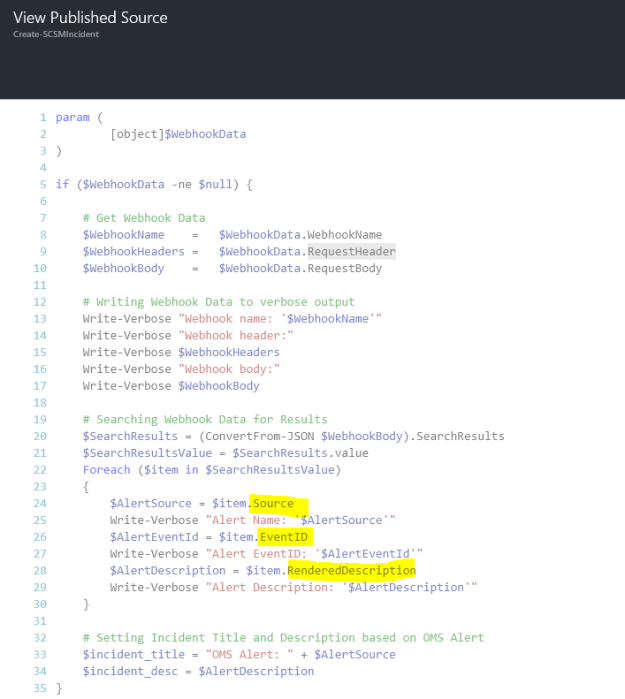
I update my PowerShell Runbook so that I can process the WebhookData, and get the WebhookName, WebhookHeaders and WebhookBody. When I have the WebhookBody, I can get the SearchResults and by using ConvertFrom-JSON loop trough the value array to get the fields I’m looking for like this:

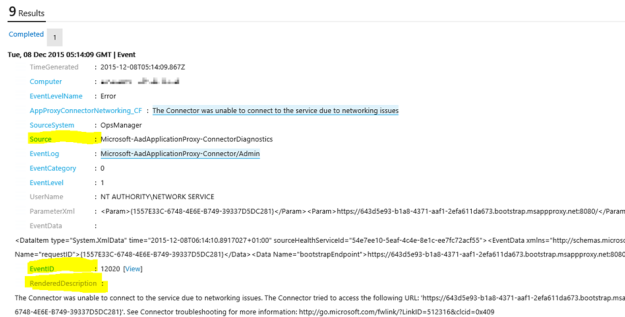
In this case I want the Source, EventID and RenderedDescription, which also corresponds to the values from the Alert in OMS, as shown below. I then use these values for the Incident Title and Description in the PowerShell Runbook.

The complete Azure Automation PowerShell Runbook is shown below:

param (
[
object]$WebhookData
)

if ($WebhookData -ne $null) {

# Get Webhook Data
$WebhookName = $WebhookData.WebhookName
$WebhookHeaders = $WebhookData.RequestHeader
$WebhookBody = $WebhookData.RequestBody

# Writing Webhook Data to verbose output
Write-Verbose Webhook name: ‘$WebhookName’
Write-Verbose Webhook header:
Write-Verbose $WebhookHeaders
Write-Verbose Webhook body:
Write-Verbose $WebhookBody

# Searching Webhook Data for Value Results
$SearchResults = (ConvertFrom-JSON $WebhookBody).SearchResults
$SearchResultsValue = $SearchResults.value
Foreach ($item in $SearchResultsValue)
{
# Getting Alert Source, EventID and RenderedDescription
$AlertSource = $item.Source
Write-Verbose Alert Name: ‘$AlertSource’
$AlertEventId = $item.EventID
Write-Verbose Alert EventID: ‘$AlertEventId’
$AlertDescription = $item.RenderedDescription
Write-Verbose Alert Description: ‘$AlertDescription’
}

# Setting Incident Title and Description based on OMS Alert
$incident_title = OMS Alert: + $AlertSource
$incident_desc = $AlertDescription
}
else
{
# Setting Generic Incident Title and Description
$incident_title = Azure Automation Generated Alert
$incident_desc = This Incident is generated from an Azure Automation Runbook via Hybrid Worker
}

# Getting Assets for SCSM Management Server Name and Credentials
$scsm_mgmtserver = Get-AutomationVariable -Name SCSMServerName
$credential = Get-AutomationPSCredential -Name SCSMAASvcAccount

# Create Remote Session to SCSM Management Server
#
(Specified credential must be in Remote Management Users local group and SCSM operator)
$session = New-PSSession -ComputerName $scsm_mgmtserver -Credential $credential

# Import module for Service Manager PowerShell CmdLets
$SMDIR = Invoke-Command -ScriptBlock {(Get-ItemProperty hklm:/software/microsoft/System Center/2010/Service Manager/Setup).InstallDirectory} -Session $session
Invoke-Command -ScriptBlock { param($SMDIR) Set-Location -Path $SMDIR } -Args $SMDIR -Session $session
Import-Module .\Powershell\System.Center.Service.Manager.psd1 -PSSession $session

# Create Incident
Invoke-Command -ScriptBlock { param ($incident_title, $incident_desc)

# Get Incident Class
$IncidentClass = Get-SCSMClass -Name System.WorkItem.Incident

# Get Prefix for Incident IDs
$IncidentPrefix = (Get-SCSMClassInstance -Class (Get-SCSMClass -Name System.WorkItem.Incident.GeneralSetting)).PrefixForId

# Set Incident Properties
$Property = @{Id=$IncidentPrefix{0}
Title
= $incident_title
Description
= $incident_desc
Urgency
= System.WorkItem.TroubleTicket.UrgencyEnum.Medium
Source
= SkillSCSM.IncidentSourceEnum.OMS
Impact
= System.WorkItem.TroubleTicket.ImpactEnum.Medium
Status
= IncidentStatusEnum.Active
}

# Create the Incident
New-SCSMClassInstance -Class $IncidentClass -Property $Property -PassThru

} -Args $incident_title, $incident_desc -Session $session

Remove-PSSession $session

After publishing the updated Runbook I’m ready for the OMS Alert to trigger.

When the OMS Alert triggers

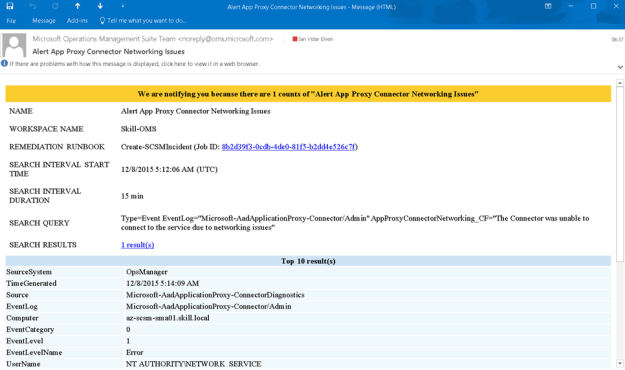
The next time this OMS Alert triggers, I can verify that the Runbook is started and an Incident is created. Since I also wanted an email notification, I also received that:

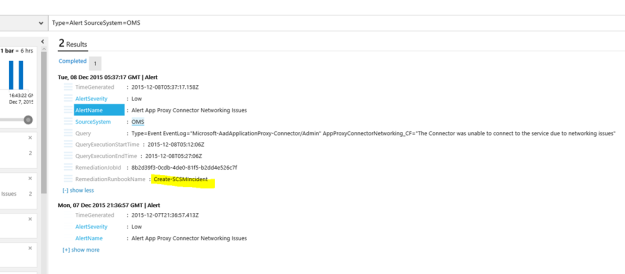
In Operations Management Suite, I search for any OMS Alerts generated by using the query “Type=Alert SourceSystem=OMS”:

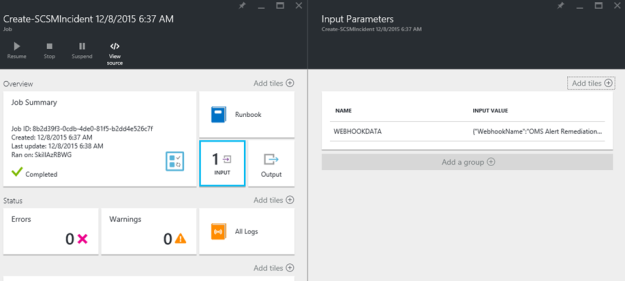
In Azure Automation, I can see that the Runbook has launched a job:

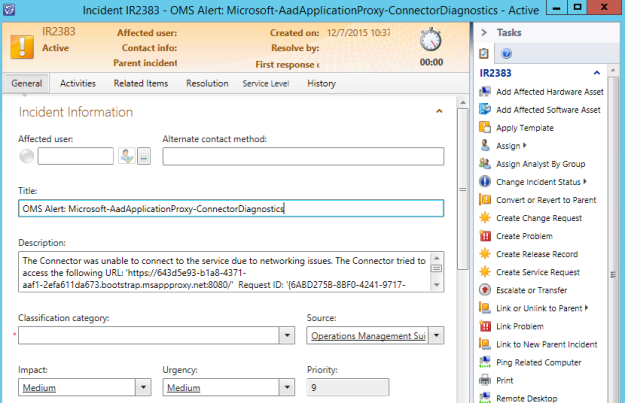
And most importantly, I can see that the Incident is created in Service Manager with the info I specified:

That concludes this two-part blog article on how to create SCSM Incidents from OMS Alerts. OMS Automation rocks!

Creating SCSM Incidents from OMS Alerts using Azure Automation – Part 1

There has been some great announcements recently for OMS Alerts in Public Preview (http://blogs.technet.com/b/momteam/archive/2015/12/02/announcing-the-oms-alerting-public-preview.aspx) and Webhooks support for Hybrid Worker Runbooks (https://azure.microsoft.com/en-us/updates/hybrid-worker-runbooks-support-webhooks/). This opens up for some scenarios I have been thinking about.

This 2-part blog will show how you can create a new Service Manager Incident from an Azure Automation Runbook using a Hybrid Worker Group, and with OMS Alerts search for a condition and generate an alert which triggers this Azure Automation Runbook for creating an Incident in Service Manager via a Webhook and some contextual data for the Alert.

This is the first part of this blog post, so I will start by preparing the Service Manager environment, creating the Azure Automation Runbook, and testing the Incident creation via the Hybrid Worker.

Prepare the Service Manager Environment

First I want to prepare my Service Manager Environment for the Incident creation via Azure Automation PowerShell Runbooks. I decided to create a new Incident Source Enumeration for ‘Operations Management Suite’, and also to create a new account with permissions to create incidents in Service Manager to be used in the Runbooks.

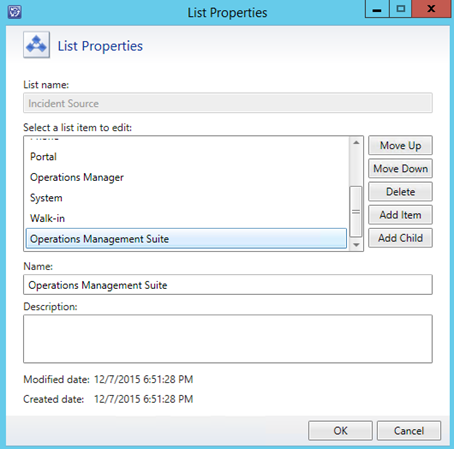
To create the Source I edited the Library List for Incident Source like this:

To make it easier to refer to this Enumeration Value in PowerShell scripts, I define my own ID in the corresponding Management Pack XML:

And specifying the DisplayString for the ElementID for the Languages I want:

The next step is to prepare the account for the Runbook. As Azure Automation Runbooks on Hybrid Workers will run as Local System, I need to be able to run my commands as an account with permissions to Service Manager and to create Incidents.

I elected to create a new local Active Directory account, and give that account permission to my Service Manager Management Server.

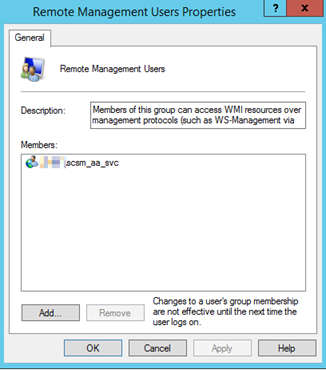
With the new account created, I added it to the Remote Management Users local group on the Service Manager Management Server:

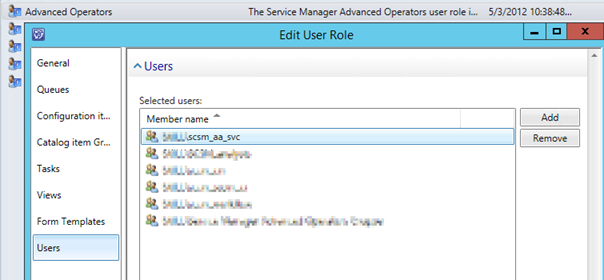
Next I added this account to the Advanced Operators Role Group in Service Manager:

Adding the account to the Advanced Operators group is more permission than I need for this scenario, but will make me able to use the same account for other work item scenarios in the future.

With the Service Manager Enviroment prepared, I can go to the next step which is the PowerShell Runbook in Azure Automation.

Create an Azure Automation Runbook for creating SCSM Incidents

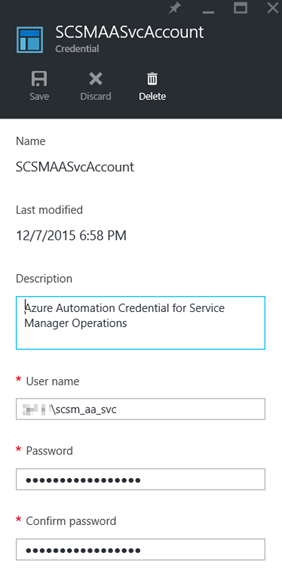
I created a new PowerShell Script based Runbook in Azure Automation for Creating Incidents. This Runbook are using a Credential Asset to run Remote PowerShell session commands to my Service Manager Management Server. The Credential Asset is the local Active Directory Account I created in the previous step:

I also have created a variable for the SCSM Management Server Name to be used in the Runbook.

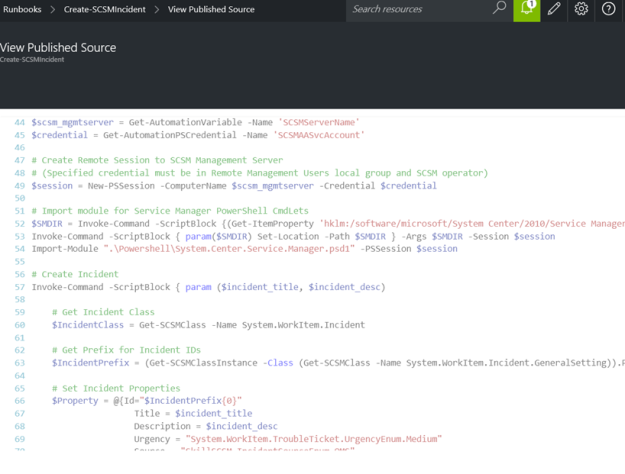
The PowerShell Runbook can then be created in Azure Automation, using my Automation Assets, and connecting to Service Manager for creating a new Incident as specified:

The complete PowerShell Runbook is show below:

# Setting Generic Incident Title and Description
$incident_title = Azure Automation Generated Alert
$incident_desc = This Incident is generated from an Azure Automation Runbook via Hybrid Worker

# Getting Assets for SCSM Management Server Name and Credentials
$scsm_mgmtserver = Get-AutomationVariable -Name SCSMServerName
$credential = Get-AutomationPSCredential -Name SCSMAASvcAccount

# Create Remote Session to SCSM Management Server
#
(Specified credential must be in Remote Management Users local group and SCSM operator)
$session = New-PSSession -ComputerName $scsm_mgmtserver -Credential $credential

# Import module for Service Manager PowerShell CmdLets
$SMDIR = Invoke-Command -ScriptBlock {(Get-ItemProperty hklm:/software/microsoft/System Center/2010/Service Manager/Setup).InstallDirectory} -Session $session
Invoke-Command -ScriptBlock { param($SMDIR) Set-Location -Path $SMDIR } -Args $SMDIR -Session $session
Import-Module .\Powershell\System.Center.Service.Manager.psd1 -PSSession $session

# Create Incident
Invoke-Command -ScriptBlock { param ($incident_title, $incident_desc)

# Get Incident Class
$IncidentClass = Get-SCSMClass -Name System.WorkItem.Incident

# Get Prefix for Incident IDs
$IncidentPrefix = (Get-SCSMClassInstance -Class (Get-SCSMClass -Name System.WorkItem.Incident.GeneralSetting)).PrefixForId

# Set Incident Properties
$Property = @{Id=$IncidentPrefix{0}
Title
= $incident_title
Description
= $incident_desc
Urgency
= System.WorkItem.TroubleTicket.UrgencyEnum.Medium
Source
= SkillSCSM.IncidentSourceEnum.OMS
Impact
= System.WorkItem.TroubleTicket.ImpactEnum.Medium
Status
= IncidentStatusEnum.Active
}

# Create the Incident
New-SCSMClassInstance -Class $IncidentClass -Property $Property -PassThru

} -Args $incident_title, $incident_desc -Session $session

Remove-PSSession $session
The script should be pretty straightforward to interpret. The most important part is that it would require to be run on a Hybrid Worker Group with Servers that can connect via PowerShell Remote to the specified Service Manager Management Server. The Incident that will be created are using a few variables for incident title and description (these will be updated for contextual data from OMS Alerts in part 2), and some fixed data for Urgency, Impact and Status, along with my custom Source for Operations Management Suite (ref. the Enumeration Value created in the first step).

After publishing this Runbook I’m ready to run it with a Hybrid Worker.

Testing the PowerShell Runbook with a Hybrid Worker

Now I can run my Azure Automation PowerShell Runbook. I select to run it on my previously defined Hybrid Worker Group.

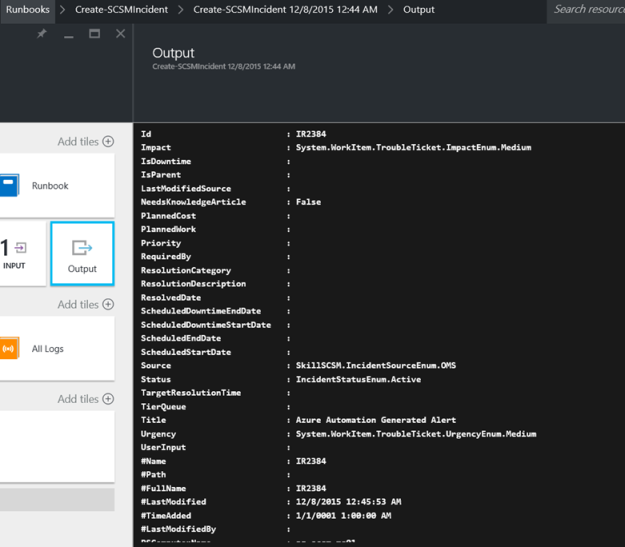
The Runbook is successfully completed, and the output is showing the new incident details:

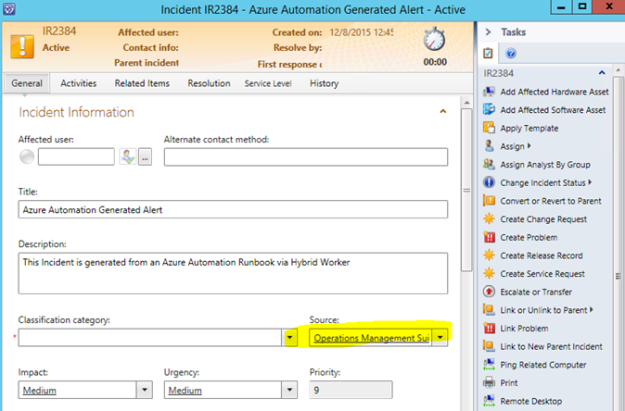
I can also see the Incident created in Service Manager:

That concludes this first part of this blog post. Stay tuned for how to create an OMS Alert and trigger this Runbook in part 2!

How to add Azure AD Application Proxy Connector Log to Operations Management Suite

If you have published Proxy Applications with Azure AD App Proxy, you will also have installed one or more Application Proxy Connectors in your environment.

When you install the Application Proxy Connector, you will also get an event log for the Connectors Information, Warning or Error events.

I wanted to bring these events to my Operations Management Suite (OMS) environment, so this blog post shows how to do that.

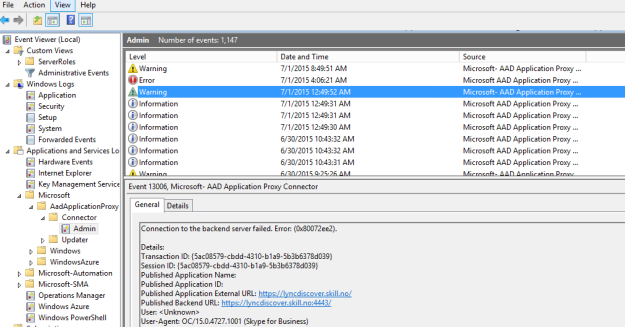
First, let us look at the event log in question. Here I have some events, I also see that I have some warning and error events, showing that I have an issue with connecting to a backend server published with Azure AD App Proxy:

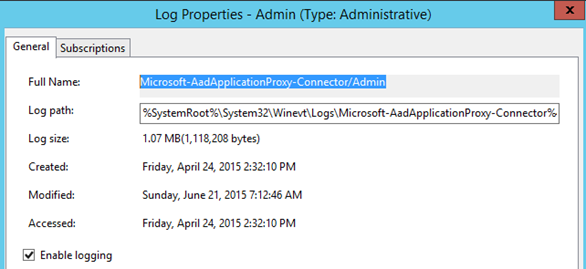
Before I can add this event log to OMS, I need to determine the name of the event log. I select Properties for the log:

The name of the log is Microsoft-AadApplicationProxy-Connector/Admin.

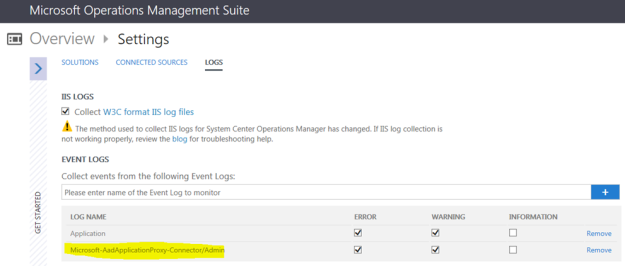
Now I can log into Operations Management Suite to configure the log source. I go to Settings and select the Logs section. I then add the name of the Application Proxy Connector log, and select which type of events that I want to collect. In my case I select Error and Warning.

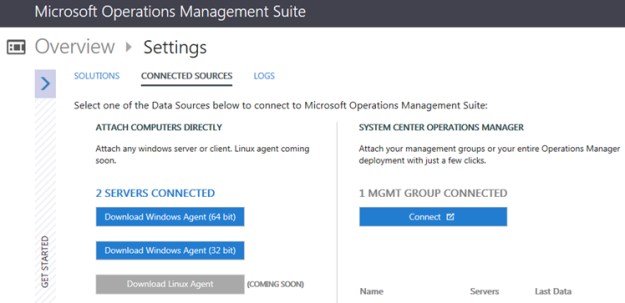
When saving that, OMS will soon start collection event log entries from the Connector Proxy log, assuming of course that the server in question have an agent installed, either directly or via Operations Manager Management Group:

Let us see how it looks when data from the event log are appearing in OMS.

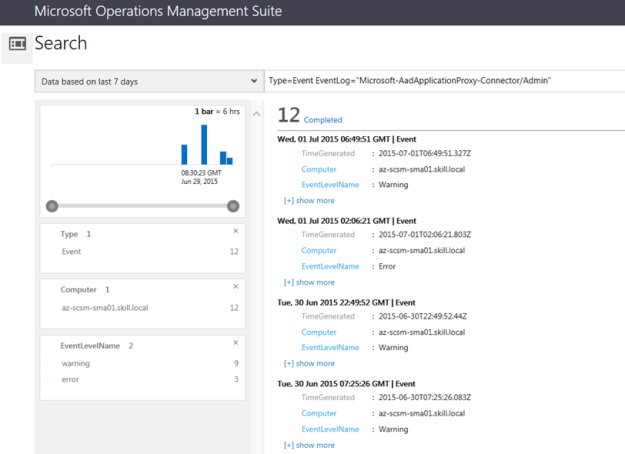
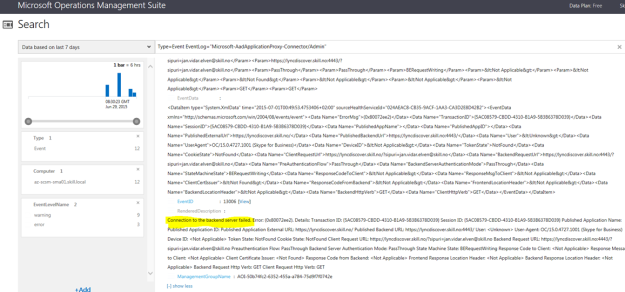
I start by doing a Log Search. I can either specify the query directly, like this: Type=Event EventLog=”Microsoft-AadApplicationProxy-Connector/Admin”, or I can select from all events and filter my way to the event log I want to.

This is how I specified the query:

I can see that I have some errors and warnings, let us drill into one of them. I do this by clicking [+] show more. I can now see the same error with backend as I had in the local event log:

So, my objective for getting the Connector Proxy event log data to OMS has been fulfilled, and I can start grouping, filtering and searching the log data.

As a last step, let us add a Dashboard view for this data.

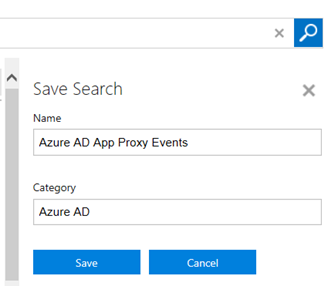
First, I select to Save my Search:

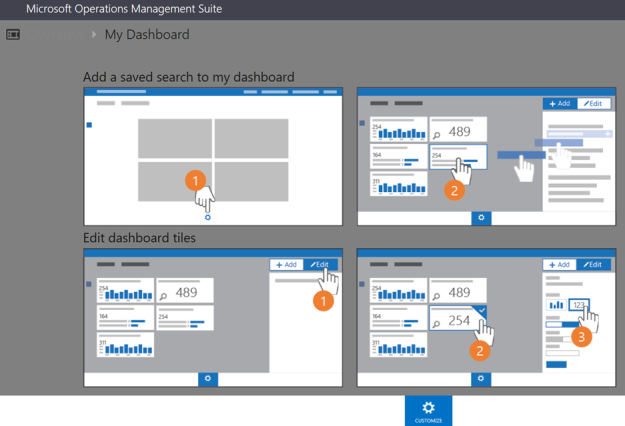
Then I go to My Dashboard, and select Customize:

I find my Saved Search and add it to the Dashboard:

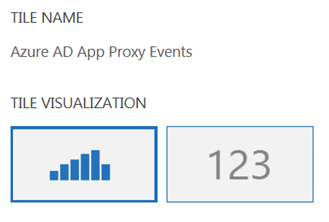
If I want to I can customize the Tile Visualization:

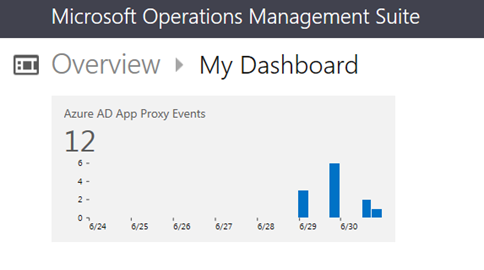
When I finish customizing, I now have a Dashboard Tile for Azure AD App Proxy Events, and by clicking it, I am going directly to the Log Search:

Hope this has been helpful, happy log searching in OMS!