Tag Archives: Azure Monitor

Alert on On-premises Connectivity for Self Service Password Reset using Azure Monitor and Azure AD Activity Logs in Log Analytics

Recently I wrote a blog post on how to get started with integration of Azure AD Activity Logs to Azure Log Analytics. Setting up this is a requirement for the solution in this blog post, so make sure you have set this up first: https://gotoguy.blog/2018/11/06/get-started-with-integration-of-azure-ad-activity-logs-to-azure-log-analytics/.

In this blog post I wanted to show a practical example on how to create an alert for when Azure AD Self Service Password fails in password writeback because of connectivity error to the On-premises environment.

Build the query

If you know the schema, you can write the query directly, but more often than not you will work out these scenarios by exploring your actual log data. In my example we had a concrete example where password resets failed because of On-premises connectivity error. Looking into the Azure Log Analytics logs, I started with this simple query against AuditLogs:

image

After that I looked into the filters, and found that I could filter on Failures:

image

This resultated in some failure results. Exploring the results in the bottom right windows, I found that the failures had a ResultDescription of “OnPremisesConnectivityError”:

image

By clicking on the plus sign above I add that to the query:

image

I want to save my query next, so that I have it available for later:

image

Now that I have the results I want I can proceed to create an Alert Rule. Btw, here is the full query (I have since amended it to include OnPremisesConnectivityFailure in addition):

AuditLogs
| where Category == "Self-service Password Management"
| where ResultType == "Failure"
| where ResultDescription == "OnPremisesConnectivityError" or ResultDescription == "OnPremisesConnectivtyFailure"

Create an Alert Rule

Next, I can create a new Alert Rule for this query, something you can do directly from the query:

image

This next step would bring me over to the Azure Monitor and Rules Management section. The alert target (OMS/Log Analytics Workspace) and target hierarchy (Azure Subscription and Resource Group) should already be specifed:

image

Now I need to configure the alert criteria. Note that currently monthly cost for this alert is $1.50. Click on the criteria to configure the signal logic:

image

Here we see the query from before, as well as we need to set a threshold for number of results, and a period and frequency. Pricing details can be found at: https://azure.microsoft.com/en-us/pricing/details/monitor/. If you look at Alert signals and Log section, you’ll see that alerts with frequency of 5 minutes is $1.5, 10 minutes $1 and 15 minutes $0.5. This is per log monitored. I changed my period and frequency to 15 minutes:

image

After I click done I see that the alert criteria is correctly configured with a price of $0.50:

image

Next I need to specify the alert details, for example like below. You also have the option to supress multiple alerts inside a time window. I configured 60 minutes:

image

Next I need to either select an existing action group or create a new. An action group decides which action to take when an alert occures:

image

I’ll create a new action group for now. In this action group I will select to send an e-mail to a group in my company. As you see in the image below I have several options for action type, examples of use can be:

  • Trigger e-mail, SMS, push or other notifications.
  • Trigger Azure Functions for running some code logic.
  • Trigger Logic App for executing a business flow logic.
  • Trigger a webhook for posting a status, for example to a Microsoft Teams webhook.
  • Send the Alert via ITSM connector to create an incident in your connected ITSM system.
  • Trigger a Runbook in Azure Automation to run your own PowerShell runbooks, or you can use one of the built-in runbooks for restart, stop, remove or scale up/down VM.

image

When selecting Email I need to specify an e-mail address for the user/group I want to notify:

image

After that I’m ready to create the Alert rule:

SNAGHTML50ef585

After I created the rule, the group e-mail address I specified received this e-mail, confirming that it is now part of an action group:

image

If you want to locate and change this alert rule at a later stage, you will find it under Azure Monitor and Alert Rules:

image

Thats it, now we can just wait for future Self-Service Password Reset or Change connectivity errors, and we will get notified.

Testing the Alert rule Notification

For testing, I just wanted to force the error by logging into my Azure AD Connect Server and stop the service.

After that I tried to reset or change my password, resulting in this error message shown to the user:

image

Now in this situation, most users will either just wait and try again later, try one more time and then give up, and if you are lucky they will contact their IT admin and notify of the error. More often than not users just leave it there, and not notify anyone. This is where it is useful to get an alert as we have created here, because then you as an IT admin can proactively analyze and fix the error before it affects more users. This is the alert I received to my specified group:

image

We can directly click on the result to get into details for the error, for example which user was affected, from which IP address and more:

image

I don’t know about you, but I think this is just brilliant 🙂 With the integration of Azure AD Activity Logs in Log Analytics, I can really explore and analyze a lot of the operations going on in my tenant, and using Azure Monitor I can create alert rules that notifies or trigger other actions to handle those alerts.

Thanks for reading, more blog post will follow on this subject of Azure AD and Log Analytics, so stay tuned!

Get started with integration of Azure AD Activity Logs to Azure Log Analytics

Recently Microsoft announced the availability of forwarding the Azure AD Activity Logs to Azure Log Analyctis. You can read the announcement in full here: https://techcommunity.microsoft.com/t5/Azure-Active-Directory-Identity/Azure-Active-Directory-Activity-logs-in-Azure-Log-Analytics-now/ba-p/274843.

By bringing thousands (or even millions depending on your organization size and use of Azure AD), of sign-in and audit log events to Log Analytics you can finally use the power of Log Analytics for query, analyze, visualize and alert on your data.

In this blog post I will show how to get started and provide some useful tips. Most of this is already well documented in the following Microsoft Docs, but I will provide my own perspective and experience and as well let this blog post be an anchor for future detailed blog posts on the subject of analyzing Azure AD sign-in and audit logs in Log Analytics and Azure Monitor:

Set up Diagnostic Settings to Log Analytics

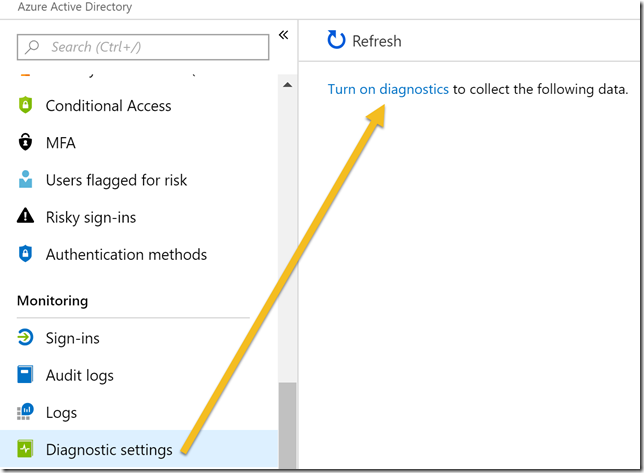
The first action we need to do is to Turn on diagnostics in the Azure AD Portal. You will need to be a Global Administrator or Security Administrator to do this:

image

PS! Another way to get to this setting to Turn on diagnostics is to either go to Sign-ins or Audit logs under Monotoring, and from there click on Export Data Settings:

SNAGHTML591fe33

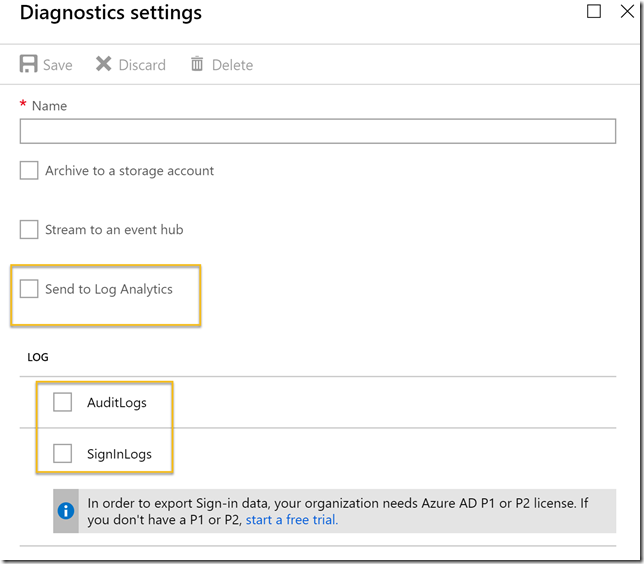
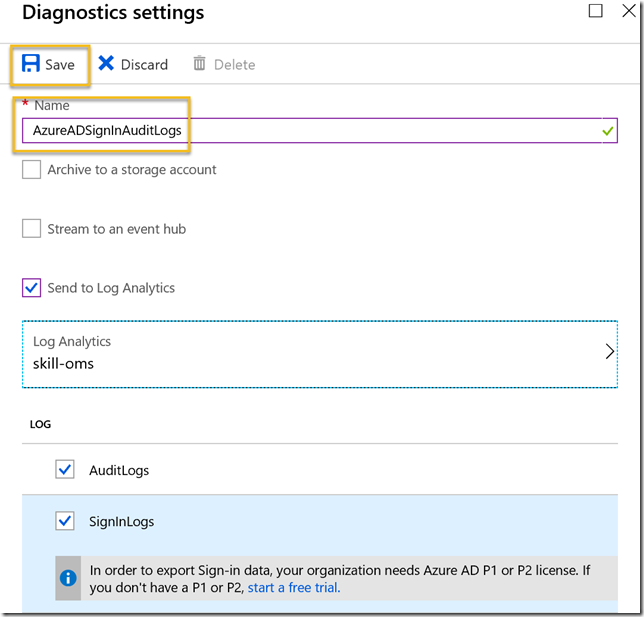
Next select to Send to Log Analytics, and then select either or both of the AuditLogs or SigninLogs.

image

Note that to be able to export Sign-in data, your organization needs Azure AD Premium P1 or P2 (or EMS E3/E5). This requirement only applies to sign-in logs, not audit logs.

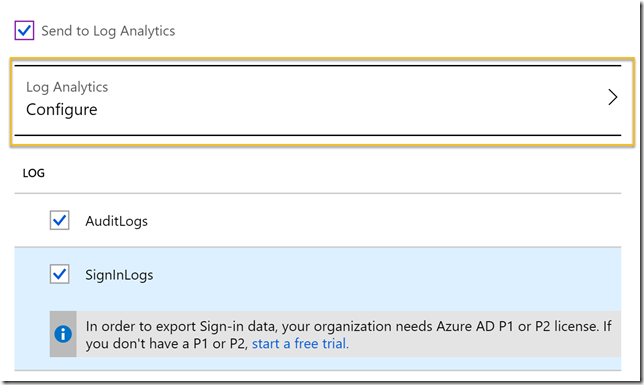
After selecting Log Analytics, and which logs to export, you need to configure which Log Analytics (still named as OMS) workspace to export the data to:

image

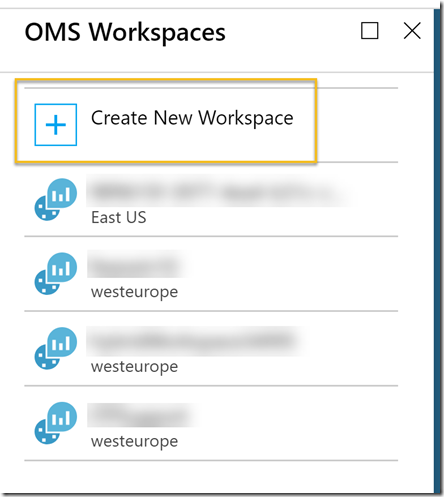
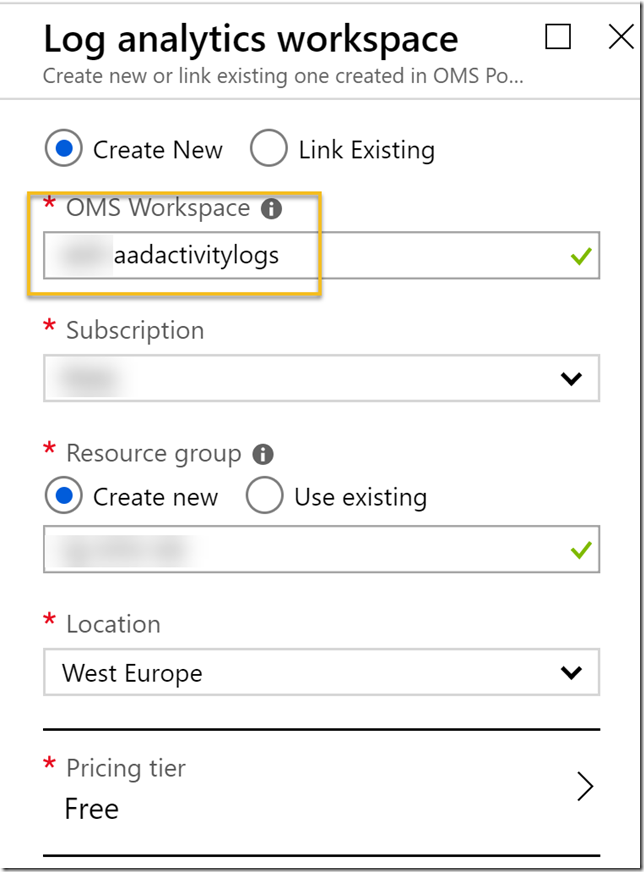
Note that this requires access to an Azure Subscription. You can either select an existing OMS workspace or create a new:

image

Important info! Usually you will need to be a Global Administrator or Security Administrator to be able to access the details of Sign-in logs or Audit logs in Azure AD, but by exporting this data to either an existing or a new Log Analytics workspace, potentially a lot more users can access that data. You need to think about if this is something you want to do, and at least control and govern which users can access that Log Analytics workspace.

For this reason alone it would probably be a better idea to create a dedicated Log Analytics workspace for the Azure AD activity logs:

image

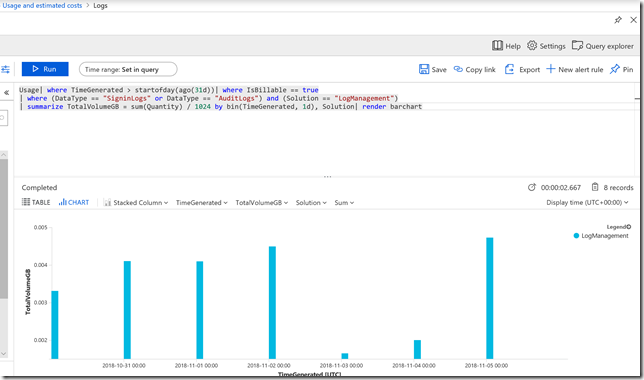
Regarding pricing, using a Log Analytics workspace for Azure AD Activity Logs alone should not incur a notable cost in most normal environments. In an environment of less than 100 users I found the following consumption per day, which is way below the amount of free data you get included:

image

If you want to save and use that same query yourself, here it is:

Usage| where TimeGenerated > startofday(ago(31d))| where IsBillable == true
| where (DataType == "SigninLogs" or DataType == "AuditLogs") and Solution == "LogManagement"
| summarize TotalVolumeGB = sum(Quantity) / 1024 by bin(TimeGenerated, 1d), Solution| render barchart

Choosing a pricing tier depends on whether the Subscription was created before April 2, 2018 or not, or whether you have elected to move to a new pricing model. The older pricing model had a choice of free tier, which had a daily cap of 500 MB and a data retention of 7 days. As the diagram above showed, most organizations will be way below the 500 MB daily cap, but a retention of only 7 days will be considered short for most analyzing needs. So under the older pricing model you would consider a standalone per GB model, giving a retention of 1 month by default, but a cost of $2.30 per GB.

The new pricing model after April 2, 2018 has a simplified pricing model. Here the first 5 GB are free and you have a default retention of 31 days. Additional GBs for ingestion are $2.99 per month, and extra retention after the first 31 days is $0.13 per GB per month. Note that this pricing model is on subscription level and affects all your Log Analytics workspaces, so you need to carefully consider any changes to the new pricing model in your subscription.

After you have selected/created a Log Analytics workspace, and provided a name for the Diagnostic settings, you are ready to Save:

image

After about 15 minutes you can start explore the Logs in the Log Analytics workspace.

Start to Analyze Azure AD Activity logs with Log Analytics

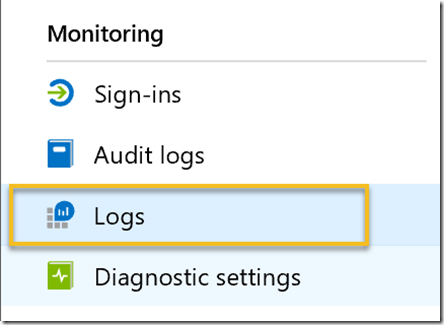
To begin analyze the exported Azure AD Activity Logs with Log Analytics, you can either go to the Log Analytics section in your Azure Portal. You can also access the logs directly from Azure Active Directory from under the Monitoring section, which will take you directly to the configured Log Analytics workspace:

image

By default this will open a search query showing sample data from all your Log Analytics workspace.

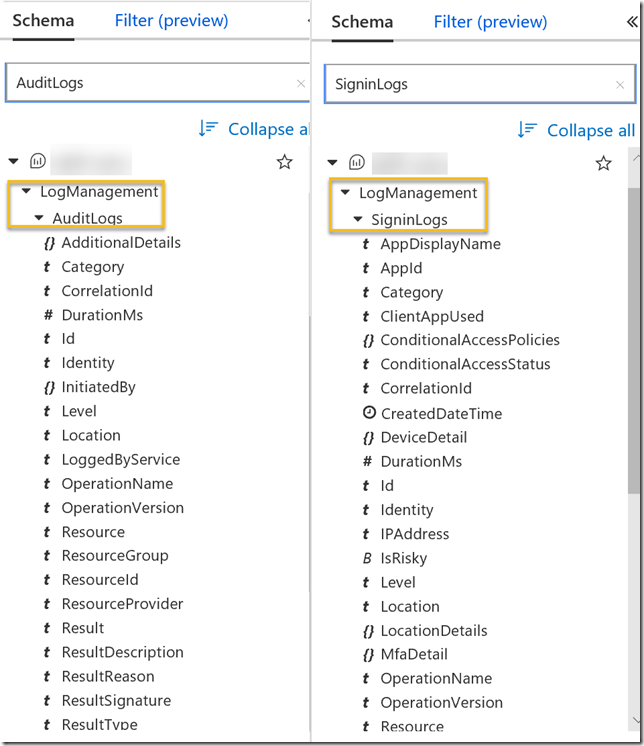
I find that a good way to start learning about the sign-in and audit logs is to look at the schema. The SigninLogs and AuditLogs schemas should appear right under LogManagement as shown below:

SNAGHTML5fc1b7b

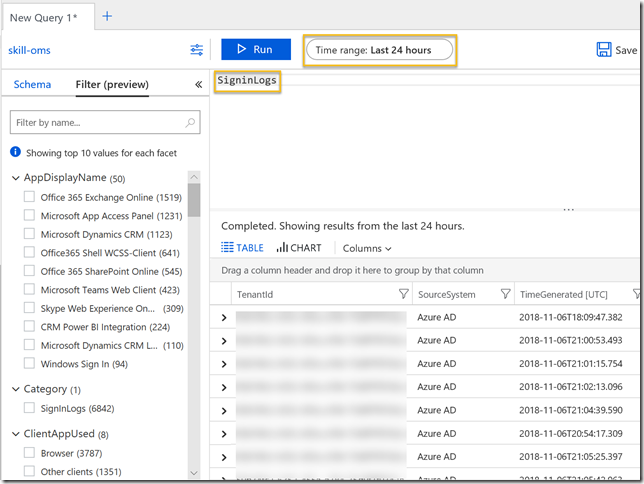
To look at the SigninLogs just add that to the query window and select a time range and click Run:

image

Depending on your sample data you can start filter on the left side, for example to look at only certain app sign ins, or client apps used, location and more..

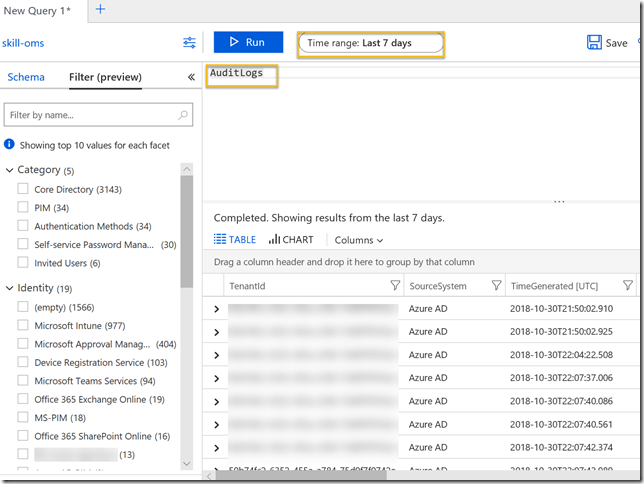
Similarly for AuditLogs, in the following example I have set a time range of last 7 days:

image

See the links in the beginning of this blog post for some more sample queries and you can also import some sample views.

So now that we have a working diagnostic setting that exports my Azure AD sign-in and audit logs to Azure Log Analytics, I’m ready to explore some interesting scenarios for analyzing this data. This will be a topic for upcoming blog posts, so stay tuned for that!

Thanks for reading so far, I’m really excited for this feature! Smile