A while back I wrote a blog post on how you could download, install and use a separate Azure AD PIM PowerShell Module for managing Privileged Roles, https://gotoguy.blog/2018/05/22/getting-started-with-azure-ad-pim-powershell-module/. With the recent update of the AzureADPreview Module, the cmdlets for managing Privileged Roles are now included in the module, so there is no longer required to install a separate module for this!
In this blog post I will explain and show how these commands can be used. These PowerShell CmdLets are also at parity with the Graph API, so I will also show equivalent methods for this.
Install or Update AzureADPreview Module
First you need to either install or update the AzureADPreview Module, so that you are running on version 2.0.2.27 or newer.
Update November 23 2020: Latest version of AzureADPreview Module is 2.0.2.129.
The AzureADPreview Module can be installed from PowerShellGallery using Install-Module or Update-Module, and you can verify which version you have installed using Get-Module <modulename> –ListAvailable like this:

With that requirement out of the way we can proceed to look at the commands.
Privileged Role Management Commands
Currently in the AzureADPreview Module, there are 13 commands related to Privileged Roles:
Get-Command -Module AzureADPreview | Where-Object {$_.Name -like “*privileged*”}

The new cmdlets in AzureADPreview Module related to PIM are documented here, https://docs.microsoft.com/en-us/powershell/module/azuread/?view=azureadps-2.0-preview#privileged_role_management.
Note that some of the above commands are not in that documentation, all the new commands have a *MS* which means it is mapped to equivalent Microsoft Graph API’s.
In the interest of this blog post, here is a quick explanation of each of the available commands:
- Add-AzureADMSPrivilegedResource. Use this API to add a new azure AD MS privileged resource.
- Close-AzureADMSPrivilegedRoleAssignmentRequest. Cancel a AzureADMSPrivilegedRoleAssignmentRequest.
- Get-AzureADMSPrivilegedResource. Get azure AD MS privileged resource.
- Get-AzureADMSPrivilegedRoleAssignment. Get role assignments for a specific provider and resource.
- Get-AzureADMSPrivilegedRoleAssignmentRequest. Get role assignment request for a specific resource.
- Get-AzureADMSPrivilegedRoleDefinition. Get role definitions.
- Get-AzureADMSPrivilegedRoleSetting. Get role settings.
- Open-AzureADMSPrivilegedRoleAssignmentRequest. Create a role assignment request.
- Set-AzureADMSPrivilegedRoleAssignmentRequest. Update a role assignment request.
- Set-AzureADMSPrivilegedRoleSetting. Update role setting.
The other 3 Privileged Role commands that are still available to use, but currently are not documented on the above link to docs are:
- Get-AzureADPrivilegedRole. List all Directory Roles available for Privileged Roles assignments.
- Get-AzureADPrivilegedRoleAssignment. List active and eligible privileged role assignments.
- New-AzureADPrivilegedRoleAssignment. Creates a new privileged role assignment for specified role and user.
(*) As soon as your tenant is upgraded to using the updated Privileged Identity Management experience for Azure AD roles (see below) these three commands will be outdated and should not be used anymore.
Further on in this blog post I will provide some more examples and usage scenarios for the new Azure AD Privileged Role Management commands, and their equivalent Microsoft Graph API methods, but first something on the difference between Azure Resources and Azure AD, changes in management experience and current limitations in the PowerShell commands.
Azure Resources vs. Azure AD
As you might know, Azure AD PIM can be used for managing privileged role assignments to both Azure AD roles and Azure Resources:

The new PowerShell commands that follows the syntax verb-AzureADMSPrivilegedRole…. all require a parameter called ProviderId, which as per today only support “AzureResources”. This means that currently you can only use the new Azure AD PowerShell commands for managing PIM for Azure resources, not for Azure AD roles yet! I had this confirmed with the Microsoft Program Manager for Azure AD PIM, as you can see from the conversation https://twitter.com/stevemsft/status/1143977432690466816?s=20 and shown in the below image:

This is related to the following notice from the Azure AD PIM Microsoft Graph documentation, stating that Azure AD roles will move to the Azure resource API in the coming months:

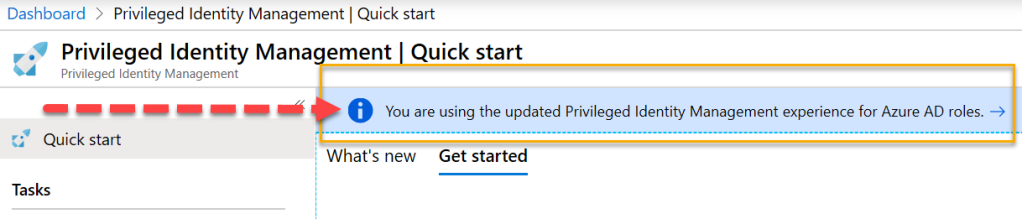
Update March 19 2020: Tenants are now starting to get migrated to the new Azure AD PIM provider similar to Azure Resources! If you log in to your tenant and see the following info in the Privileged Identity Management blade, then you can also use the new Azure AD provider, as I will show in the examples below:
As the new PowerShell commands are built on Microsoft Graph, this also means that they will work for Azure AD roles depending o the move to the Azure resources API.
Explore Privileged Resources

There are two commands for exploring and adding Privileged Azure Resources:
- Get-AzureADMSPrivilegedResource –ProviderId azureResources
- Add-AzureADMSPrivilegedResource –ProviderId azureResources
If you want to explore Privileged Azure AD roles you have to change the ProviderId like this:
- Get-AzureADMSPrivilegedResource -ProviderId aadroles
- Add-AzureADMSPrivilegedResource –ProviderId aadroles

Their equivalent Microsoft Graph API methods for Azure Resources are (Beta endpoint only as per july 2019):
- List: GET /privilegedAccess/azureResources/resources
- Get: GET /privilegedAccess/azureResources/resources/{id}
- Register: POST /privilegedAccess/azureResources/resources/register
Getting or listing Privileged Resources is based on that you have onboarded to Azure AD PIM for Azure Resources, as explained here: https://docs.microsoft.com/en-us/azure/active-directory/privileged-identity-management/pim-resource-roles-discover-resources. You can also add a privileged resource by ExternalId, which I will show an example of later.
The equivalent Graph API methods for Azure AD roles are (Beta endpoint only as per march 2020):
- List: GET /privilegedAccess/aadRoles/resources
- Get: GET /privilegedAccess/aadRoles/resources/{tenantid}
Register: POST /privilegedAccess/aadRoles/resources/register(Note per march 2020: There are currently no way to programmatically onboard tenants to PIM for Azure AD roles)
Getting or listing Privileged Azure AD roles requires that you have signed up for PIM for Azure AD roles: https://docs.microsoft.com/en-us/azure/active-directory/privileged-identity-management/pim-getting-started#sign-up-pim-for-azure-ad-roles
Examples of Exploring Privileged Azure Resources
To get a list over all privileged Azure resources, just run:
Get-AzureADMSPrivilegedResource –ProviderId AzureResources
This will return a list (capped at max 200 results), with the Id, ExternalId, Type, DisplayName and more for each resource that have been registered to Azure AD PIM:

As mentioned above the list is capped at max 200 results, which is a Microsoft Graph limitation for this privileged resource API. You can use the –Top parameter to specify a lower number of returned results, like –Top 50, but it will just ignore and cap at 200 if you for example type –Top 300.
So to return fewer results we can use the –Filter parameter which support Odata query. I have tried some different combinations, and not all will work as expected. Some examples of working filters:
Get-AzureADMSPrivilegedResource -ProviderId AzureResources -Filter “Type eq ‘resourcegroup'”
Get-AzureADMSPrivilegedResource -ProviderId AzureResources -Filter “Type eq ‘subscription'”
Get-AzureADMSPrivilegedResource -ProviderId AzureResources -Filter “DisplayName eq ‘elvsabootdiag001”
Get-AzureADMSPrivilegedResource -ProviderId AzureResources -Filter “startswith(DisplayName,’rg-‘)”

What I found DON’T work is filters for specific resource types like:
Get-AzureADMSPrivilegedResource -ProviderId AzureResources -Filter “Type eq ‘Microsoft.Compute/virtualMachines'”
..or any other specific resource type like Microsoft.Network/loadBalancers, Microsoft.Network/networkSecurityGroups, etc., which I find is a bit strange as I would like to filter on those as well.
If you know the specific resource id you can also get that privileged resource object directly:
Get-AzureADMSPrivilegedResource -ProviderId AzureResources –Id <resource id>
Lets compare this to the Microsoft Graph API methods, using Graph Explorer. To list all managed Azure Resources I run the GET /privilegedAccess/azureResources/resources like this:

Which pretty much returns the same list of resources and attributes as I did when running the PowerShell command. There is one important change though, and I mentioned earlier that the PowerShell command would only return max 200 results. In the Graph response I will receive a skip token from where if I run that I will get the next set of potentially 200 more results, and so on.
Graph can also handle filters of course, so lets try that. Here are some variations you can try out:
GET /privilegedAccess/azureResources/resources?$filter=type eq ‘resourcegroup’&$top=5
GET /privilegedAccess/azureResources/resources?$filter=displayName eq ‘rg-auth-dc’
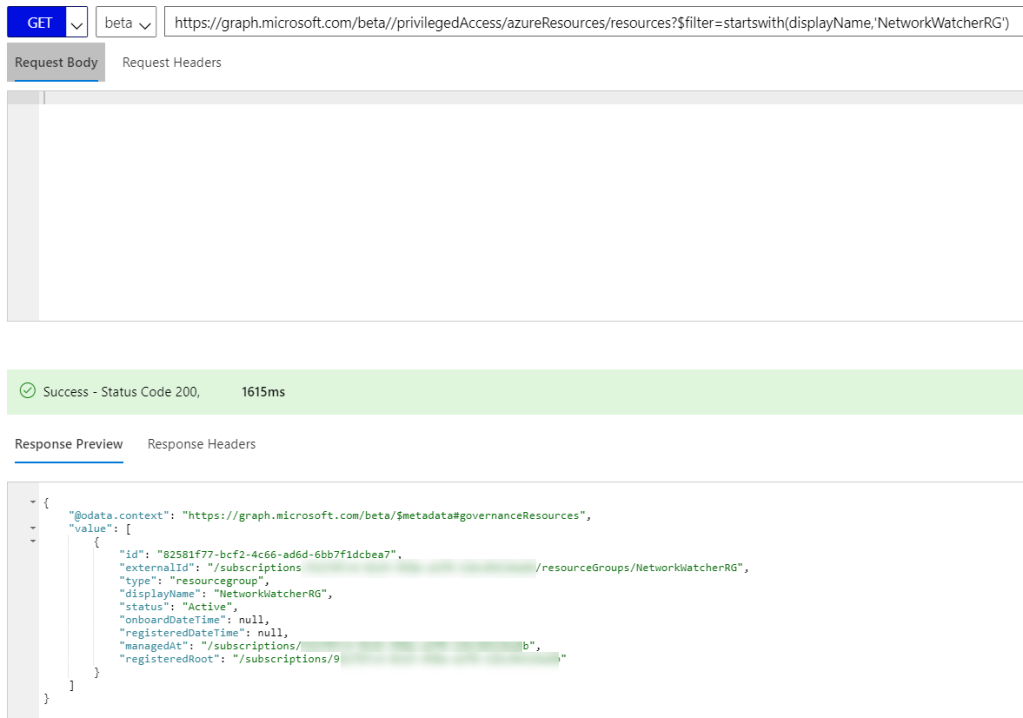
GET /privilegedAccess/azureResources/resources?$filter=startswith(displayName,’rg-‘)
And if you want to get a specific resource with Graph, just specify the id like this:
GET /privilegedAccess/azureResources/resources/ad7327ba-50f4-4f03-a4ee-029f310b6775
Which will return the specific resource in the response:

Last, to add a resource as a managed resource to Azure AD PIM, using PowerShell can be done like this:
Add-AzureADMSPrivilegedResource -ProviderId AzureResources -ExternalId “/subscriptions/<your-subscription-id>”
And via Graph:
POST /privilegedAccess/azureResources/resources/register
Request Body:
{
“externalId”: “/subscriptions/<your-subscription-id>”
}
These commands are just to get a list of and adding managed Azure resources for Azure AD PIM, i the next parts we will look into actually managing assignments and settings.
Examples of Exploring Privileged Azure AD role resource
To get a list over all tenants registered for privileged Azure AD roles, just run:
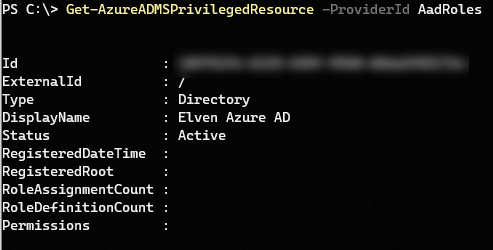
Get-AzureADMSPrivilegedResource –ProviderId aadRoles
This will return a list of directories that have been onboarded for PIM for Azure AD Roles, with the Id referring to tenant id, Type, DisplayName and more:
If you know the specific tenant id you can also get that privileged resource object directly:
Get-AzureADMSPrivilegedResource -ProviderId aadRoles –Id <tenantid>
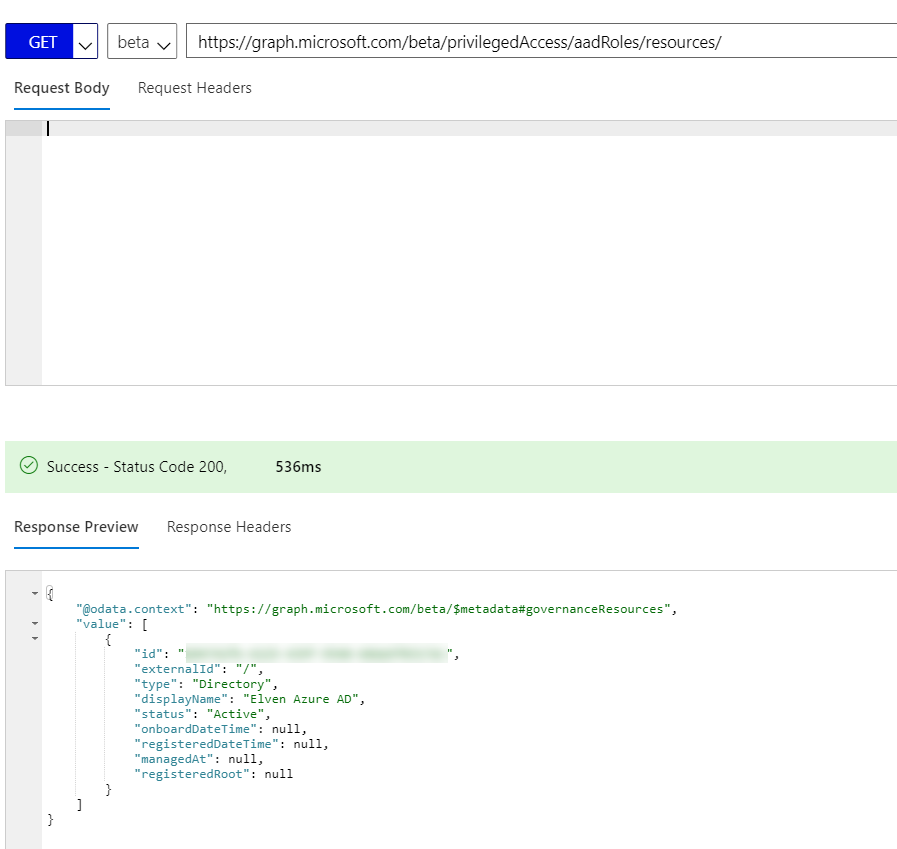
Lets compare this to the Microsoft Graph API methods, using Graph Explorer. To list all managed Azure AD roles directories I run the GET /privilegedAccess/aadRoles/resources like this:
Note that you also can specify the resource for Azure AD roles directly, by specifying the tenant id like this:
GET /privilegedAccess/aadRoles/resources/{tenant-id}
These commands are just to get a list and settings for tenant onboarded to Azure AD roles management with Azure AD PIM, i the next parts we will look into actually managing assignments and settings.
Explore Role Assignments

The following command can be used for listing or getting specific role assignments for Azure resources:
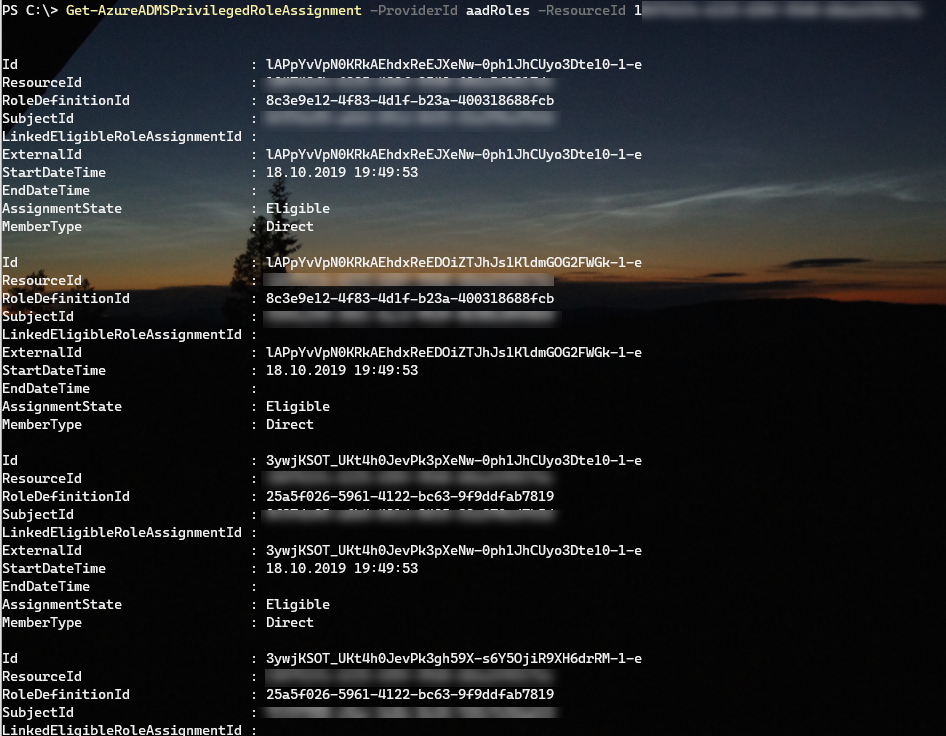
- Get-AzureADMSPrivilegedRoleAssignment –ProviderId AzureResources –ResourceId <resource id>
And for Azure AD roles, the command would be the following, where the resource id is the tenant/directory id:
- Get-AzureADMSPrivilegedRoleAssignment –ProviderId aadRoles –ResourceId <tenant id>

The equivalent Microsoft Graph API methods for Azure Resources:
- List: GET /privilegedAccess/azureResources/resources/{resourceId}/roleAssignments
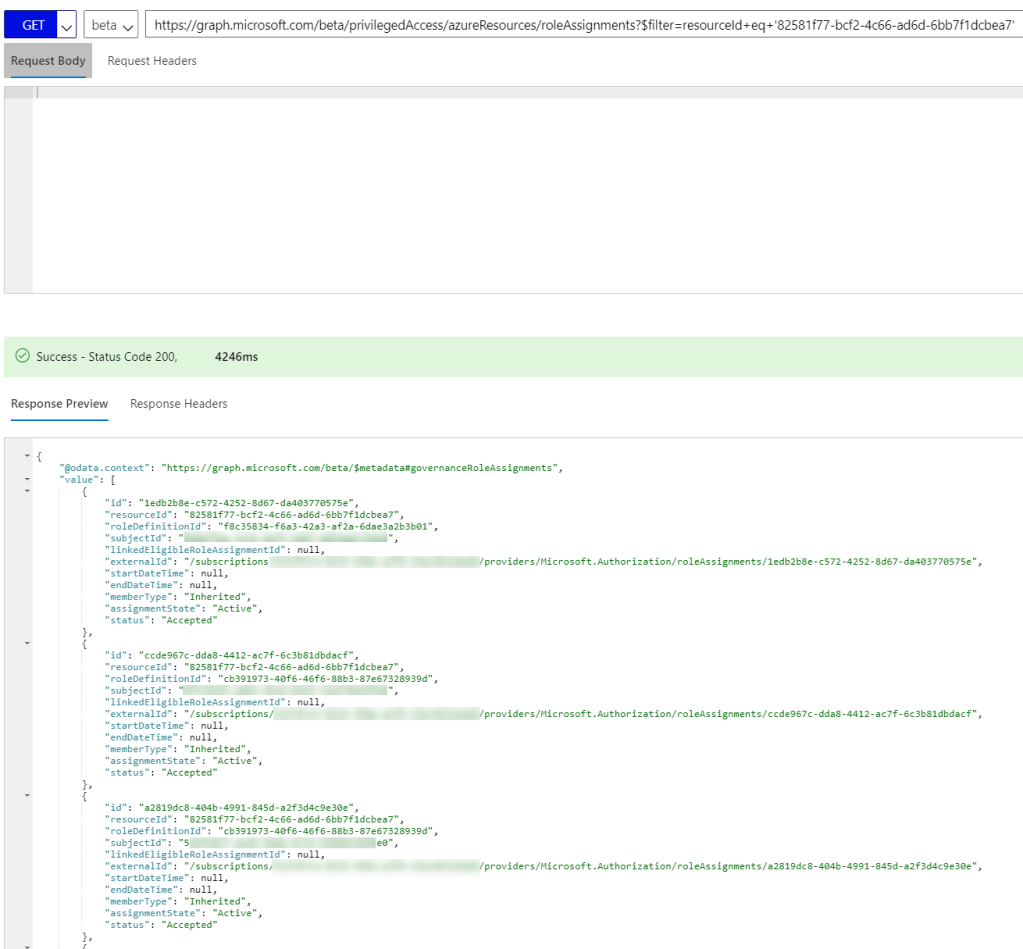
- List: GET /privilegedAccess/azureResources/roleAssignments?$filter=resourceId+eq+'{resourceId}’
- List (Mine): GET /privilegedAccess/azureResources/roleAssignments?$filter=subjectId+eq+'{myId}’
- Get: GET /privilegedAccess/azureResources/resources/{resourceId}/roleAssignments/{id}
- Get: GET /privilegedAccess/azureResources/roleAssignments/{id}?$filter=resourceId+eq+'{resourceId}’
- Get (Mine): GET /privilegedAccess/azureResources/roleAssignments/{id}?$filter=subjectId+eq+'{myId}’
And these are the main Graph API methods for Azure AD roles:
- List: GET /privilegedAccess/aadRoles/resources/{tenantId}/roleAssignments
- List (Mine): GET /privilegedAccess/aadRoles/resources/{tenantId}/roleAssignments?$filter=subjectId+eq+'{myId}’
- List (Role): GET privilegedAccess/aadRoles/resources/{tenantId}/roleAssignments?filter=roleDefinitionId eq ‘{myRoleDefinitionId}’
Now that seems a lot of different variations for Graph calls for the one PowerShell command, but as you will see later Graph can be a little more flexible in querying in different ways.
Examples of Exploring Role Assignments for Azure Resources
Lets see some samples for PowerShell first. Now we need to supply a resource id, that can be subscription object, a resource group object, any type of resource objects like virtual machines, virtual networks and so on, and even management group objects. So based on the commands previously shown in the blog post, we should be able to get out the resource id’s first, for example like this:
$myResource = Get-AzureADMSPrivilegedResource -ProviderId AzureResources -Filter "DisplayName eq 'NetworkWatcherRG'"
Get-AzureADMSPrivilegedRoleAssignment –ProviderId AzureResources –ResourceId $myResource.Id
So this returns a list of role assignments for the specified resource, each assignment has its own id, as well as the ResourceId, the RoleDefinitionId (which role that has been assigned, like reader, contributor, owner, etc), SubjectId (which user, service principal, group, etc has been assigned the role). In addition we can get info on any linked eligible assignements, start and end time for assignements, assignment state and if the assignment is active or not, or if the type is inherited or assigned directly to the resource.

The same results can be retrieved by first querying for the resource id:
And then querying for the role assignments belonging to this resource:
Basically the above command returns the same as this blade in the Azure Portal:

Examples of Exploring Role Assignments for Azure AD roles
If i want to look at Role Assignments for Azure AD roles via PowerShell you would specify ProviderId as aadRoles and the ResourceId to be the tenant id:
$myTenant = Get-TenantDetailsFromGraph
Get-AzureADMSPrivilegedRoleAssignment -ProviderId aadRoles -ResourceId $myTenant.TenantId
This will return all Azure AD role assignments in your tenant:
To return fewer results we can use the –Filter parameter which support Odata query. I have tried some different combinations, here are some examples of working filters:
Get-AzureADMSPrivilegedRoleAssignment -ProviderId aadRoles -ResourceId $myTenant.TenantId -Filter "SubjectId eq '<myId>'"
Get-AzureADMSPrivilegedRoleAssignment -ProviderId aadRoles -ResourceId $myTenant.TenantId -Filter "RoleDefinitionId eq '<myRoleDefinitionId>'"
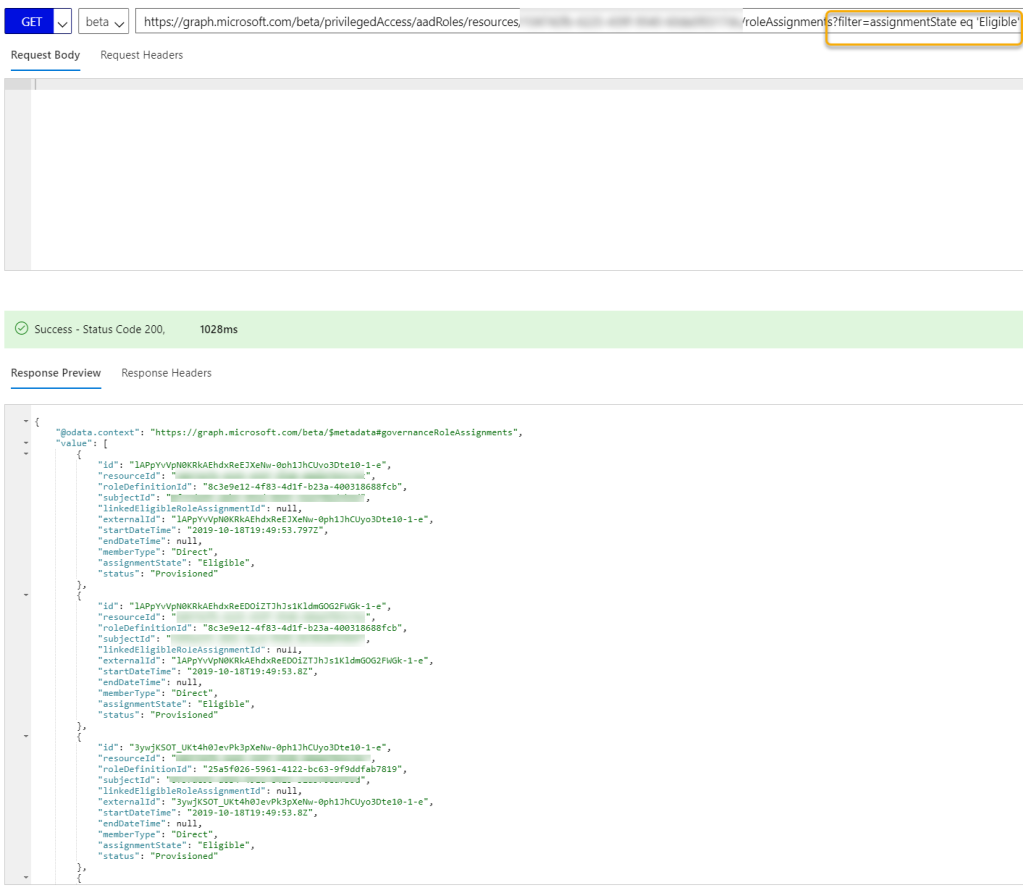
Get-AzureADMSPrivilegedRoleAssignment -ProviderId aadRoles -ResourceId $myTenant.TenantId -Filter "AssignmentState eq 'Eligible'"
Get-AzureADMSPrivilegedRoleAssignment -ProviderId aadRoles -ResourceId $myTenant.TenantId -Filter "AssignmentState eq 'Active'"
Using Graph API I can explore and list the role assignments using the same filter examples like with PowerShell above:
Now that we have control over role assignments, we can look into the role definitions and settings in the next part.
Explore and Manage Role Definitions and Settings
The following commands can be used to get and manage role definitions and settings for Azure Resources:
- Get-AzureADMSPrivilegedRoleDefinition -ProviderId AzureResources -ResourceId <myResourceId>
- Get-AzureADMSPrivilegedRoleSetting -ProviderId AzureResources -Filter “ResourceId eq ‘<myResourceId> and RoleDefinitionId eq ‘myRoleDefinitionId””
- Set-AzureADMSPrivilegedRoleSetting -ProviderId AzureResources -Id ‘<myRoleSettingsId>’ -ResourceId ‘<myResourceId>’ -RoleDefinitionId ‘<myRoleDefinitionId>’ -UserMemberSettings -UserEligibleSettings -AdminMemberSettings -AdminEligibleSettings <Microsoft.Open.MSGraph.Model.AzureADMSPrivilegedRuleSetting>
And following commands can be used to get and manage role definitions and settings for Azure AD roles:
- Get-AzureADMSPrivilegedRoleDefinition -ProviderId aadRoles -ResourceId <TenantId>
- Get-AzureADMSPrivilegedRoleSetting -ProviderId aadRoles -Filter “ResourceId eq ‘<TenantId>'”
- Set-AzureADMSPrivilegedRoleSetting -ProviderId aadRoles -Id ‘<myRoleSettingsId>’ -ResourceId ‘<TenantId>’ -RoleDefinitionId ‘<myRoleDefinitionId>’ -UserMemberSettings -UserEligibleSettings -AdminMemberSettings -AdminEligibleSettings <Microsoft.Open.MSGraph.Model.AzureADMSPrivilegedRuleSetting>

The equivalent Microsoft Graph API methods for Azure Resources:
- GET /privilegedAccess/azureResources/resources/{resourceId}/roleDefinitions
- GET /privilegedAccess/azureResources/roleDefinitions?$filter=resourceId+eq+'{resourceId}’
- GET /privilegedAccess/azureResources/resources/{resourceId}/roleDefinitions/{id}
- GET /privilegedAccess/azureResources/roleDefinitions/{id}?$filter=resourceId+eq+'{resourceId}’
- GET /privilegedAccess/azureResources/resources/<resourceId>/roleSettings
- GET /privilegedAccess/azureResources/roleSettings?$filter=resourceId+eq+'<resourceId>’
- GET /privilegedAccess/azureResources/roleSettings/{id}
- PATCH /privilegedAccess/azureResources/roleSettings/{id}
Explore and Manage Role Assignment Requests
The following command can be used for exploring and managing role assignment requests:
- Get-AzureADMSPrivilegedRoleAssignmentRequest. Get role assignment request for a specific resource.
- Open-AzureADMSPrivilegedRoleAssignmentRequest. Create a role assignment
request. - Set-AzureADMSPrivilegedRoleAssignmentRequest. Update a role assignment
request. - Close-AzureADMSPrivilegedRoleAssignmentRequest. Cancel a
AzureADMSPrivilegedRoleAssignmentRequest.

The equivalent Microsoft Graph API methods:
- GET /privilegedAccess/azureResources/resources/{resourceId}/roleAssignmentRequests
- GET /privilegedAccess/azureResources/roleAssignmentRequests?$filter=resourceId+eq+'{resourceId}’
- GET /privilegedAccess/azureResources/roleAssignmentRequests?$filter=subjectId+eq+'{myId}’
- GET /privilegedAccess/azureResources/roleAssignmentRequests/{id}
- POST /privilegedAccess/azureResources/roleAssignmentRequests
- POST /privilegedAccess/azureResources/roleAssignmentRequests/{id}/updateRequest
- POST /privilegedAccess/azureResources/roleAssignmentRequests/{id}/cancel